
Lihat juga


 20.07.2026 09:43 AM
EUR/USD
Analysis:
The downward trend that started at the end of January this year has led the quotes of the major currency pair to accumulate potentially reversal zones of various scales. Since the end of last month, the price has predominantly been moving sideways along the previously broken support level, which has turned into resistance.
Forecast:
In the coming days, a continuation of the general sideways trend of the pair is expected within a price range between the nearest opposing zones. In the first days, an upward flat is quite likely. There may be pressure on the upper boundary of the resistance zone. A resumption of the downward movement can be expected by the end of the week.
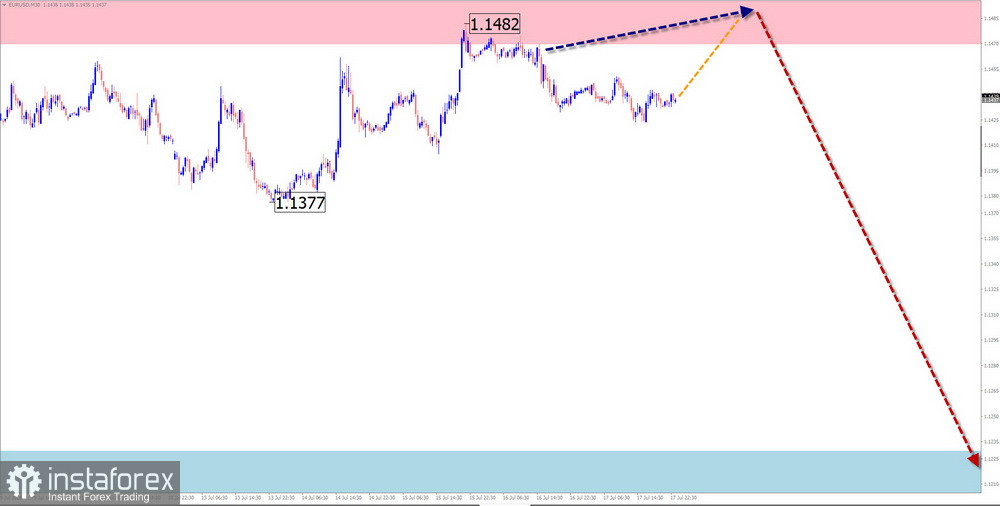
Potential Reversal Zones
Resistance:
Support:
Recommendations:
Buying: possible in fractional volumes, risky.
Selling: will become preferable after confirmed reversal signals appear in the resistance area.
USD/JPY
Analysis:
The quotes of the major pair of the Japanese yen against the US dollar continue to form the upward flat that started at the end of April this year. The unfinished segment of the main rate has been counting from the beginning of July. Over the last two weeks, a corrective part (B) has been forming in the structure. At the time of analysis, it is close to completion.
Forecast:
In the coming days, the full completion of the upward vector of movement is expected near the calculated resistance. In the first couple of days, sideways movement is not ruled out. Further, a decline towards the support boundaries may occur. An increase in volatility and a resumption of the upward trend can be expected in the second half or next week. Upon reversal, a brief breakout below the lower boundary of the calculated zone is not excluded.
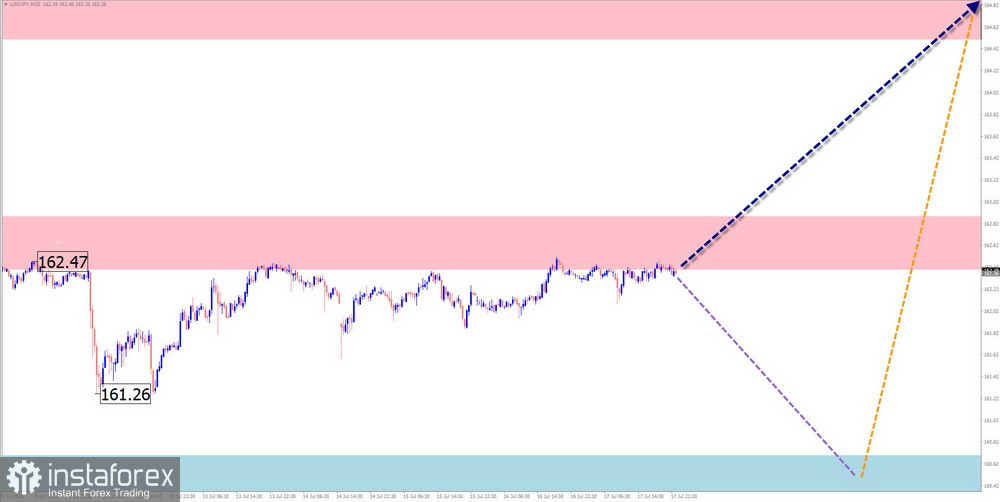
Potential Reversal Zones
Resistance:
Support:
Recommendations:
Selling: has low potential, risky.
Buying: will become relevant after the corresponding signals appear in the trading systems you use.
GBP/JPY
Analysis:
The trend of the pair of the British pound against the Japanese yen has been directed towards the upper part of the price chart for the past year. The unfinished section of this wave in the main rate has been counting since the end of April. The final part (C) of this movement is being formed. The need for an opposing correction has emerged.
Forecast:
In the coming days of the next week, movement of the pair quotes along the resistance zone is expected. In this zone, conditions for a directional change can be anticipated. A beginning of price decline can be expected by the end of the week, with a sharp increase in volatility. Synchronization of the reversal time with the release of important news blocks is highly probable.
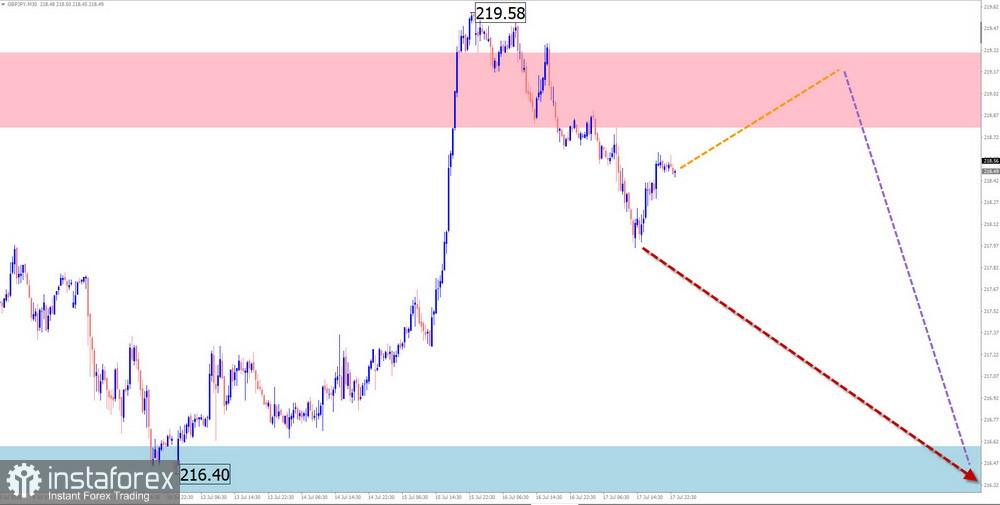
Potential Reversal Zones
Resistance:
Support:
Recommendations:
Selling: trading conditions are unfavorable. High probability of incurring losses.
Buying: can be used in trading upon the appearance of confirmed signals in the calculated support area.
USD/CAD
Analysis:
In the market of the major pair of the Canadian dollar, a bullish wave continues to take shape, counting from the beginning of May this year. Since the end of June, a corrective section (B) has been formed in this wave model, in the form of an elongated flat. Its structure appears to be formed, but at the time of analysis, no reversal signals were observed on the chart.
Forecast:
Throughout the week, a continuation of the overall sideways direction of movement is expected. In the next few days, the conclusion of the decrease near the calculated support is more likely. Subsequently, a change in trend and a resumption of bullish movement can be anticipated. A breakout beyond the boundaries of the price corridor in the coming week is unlikely.
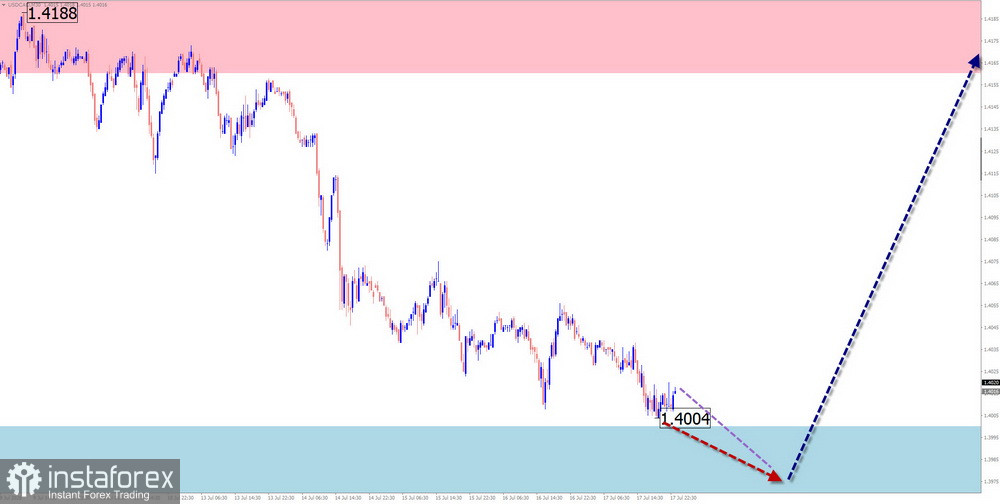
Potential Reversal Zones
Resistance:
Support:
Recommendations:
Buying: will become relevant after the appearance of confirmed signals in the calculated support zone.
Selling: has very low potential, risky.
NZD/USD
Brief Analysis:
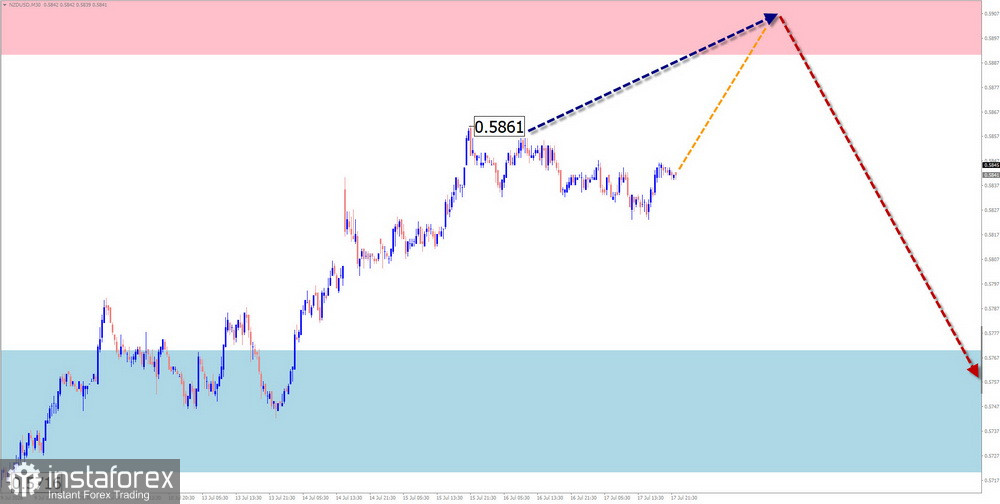
Since the beginning of this year, quotes in the major pair of the New Zealand dollar have been forming a downward wave. Over the past three weeks, the quotes have been moving against the trend, forming a correction of the last segment of the trend. This movement is approaching the final phase of formation.
Weekly Forecast:
In the coming days of the upcoming week, a continuation of the sideways directional movement with an upward vector is anticipated. A brief pressure on the upper level of resistance is not excluded. Subsequently, a reversal and the beginning of a decline can be expected. The highest volatility may be expected closer to the weekend.
Potential Reversal Zones
Resistance:
Support:
Recommendations:
Buying: has low potential, carries increased risk.
Selling: may become the main direction for trading once corresponding reversal signals appear.
Gold
Analysis:
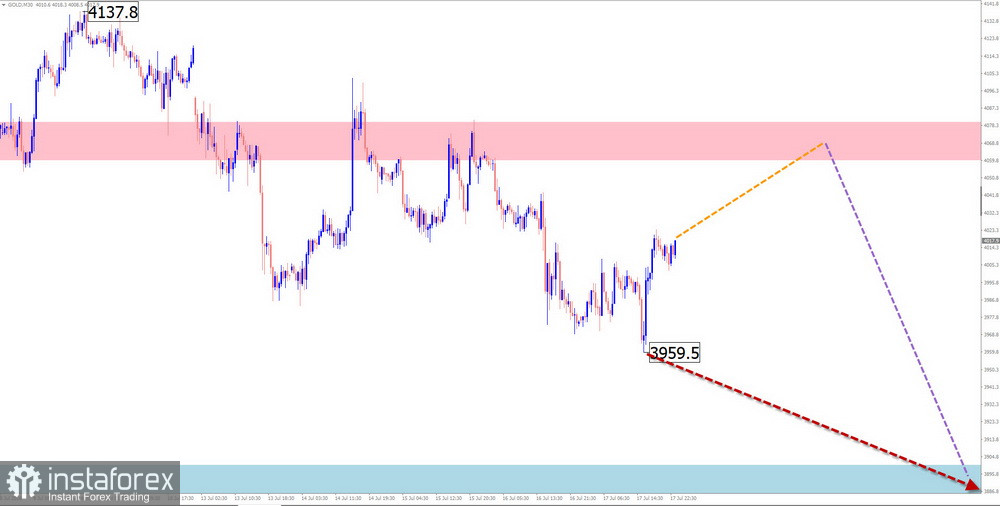
Since January, a sideways flat structure has been forming on the gold chart, resembling a descending "pennant." The unfinished trending segment of this wave started in mid-June. After breaking through a strong potential reversal zone, an intermediate pullback has formed within its structure, which is not yet complete at the time of analysis.
Forecast:
In the next couple of days, sideways movement of gold prices, along the resistance zone, is likely. In the second half of the week, a resumption of the bearish vector of movement is expected, with prices declining to the calculated support boundaries.
Potential Reversal Zones
Resistance:
Support:
Recommendations:
Selling: will be possible after corresponding signals appear in the resistance area.
Buying: risky, may lead to losses.
Notes: In the simplified wave analysis (SWA), all waves consist of three parts (A-B-C). The last unfinished wave is analyzed on each timeframe. Expected movements are shown as dotted lines.
Attention: The wave algorithm does not take into account the duration of movements of the instruments over time!


