Pola sebenarnya

Bullish Symmetrical Triangle
was formed on 06.06 at 20:55:30 (UTC+0)
signal strength 1 of 5
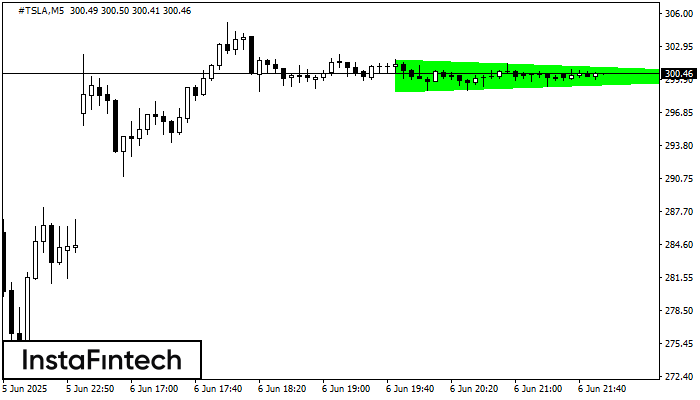
According to the chart of M5, #TSLA formed the Bullish Symmetrical Triangle pattern, which signals the trend will continue. Description. The upper border of the pattern touches the coordinates 301.78/300.20 whereas the lower border goes across 298.80/300.20. The pattern width is measured on the chart at 298 pips. If the Bullish Symmetrical Triangle pattern is in progress during the upward trend, this indicates the current trend will go on. In case 300.20 is broken, the price could continue its move toward 300.35.
The M5 and M15 time frames may have more false entry points.
Lihat juga
- All
- All
- Bearish Rectangle
- Bearish Symmetrical Triangle
- Bearish Symmetrical Triangle
- Bullish Rectangle
- Double Top
- Double Top
- Triple Bottom
- Triple Bottom
- Triple Top
- Triple Top
- All
- All
- Buy
- Sale
- All
- 1
- 2
- 3
- 4
- 5
Bawah Triple
was formed on 20.06 at 22:20:23 (UTC+0)
signal strength 1 of 5

Pola Bawah Triple telah terbentuk pada GOLD M5. Pola tersebut memiliki karakteristik sebagai berikut: level resistance 3372.86/3370.25; level support 3364.73/3364.26; dengan lebar 813 poin. Jika terjadi pemecahan (breakdown) pada level
Rangka waktu M5 dan M15 mungkin memiliki lebih dari titik entri yang keliru.
Open chart in a new window
Persegi Bearish
was formed on 20.06 at 20:57:12 (UTC+0)
signal strength 2 of 5

Menurut grafik dari M15, #GOOG terbentuk Persegi Bearish. Pola menunjukkan kelanjutan tren. Batas atas adalah 170.41, batas rendah adalah 169.00. Sinyal berarti posisi jual harus dibuka setelah menetapkan harga dibawah
Rangka waktu M5 dan M15 mungkin memiliki lebih dari titik entri yang keliru.
Open chart in a new window
Segitiga Simetris Bearish
was formed on 20.06 at 20:55:46 (UTC+0)
signal strength 1 of 5

Menurut Grafik dari M5, #TSLA dibentuk pola Segitiga Simetris Bearish. Pola ini mengisyaratkan tren penurunan lebih lanjut jika terdapat batas yang lebih rendah 317.55 ditembus. Disini, sebuah keuntungan hipotetis akan
Rangka waktu M5 dan M15 mungkin memiliki lebih dari titik entri yang keliru.
Open chart in a new window