Pola sebenarnya

Bearish Rectangle
was formed on 23.06 at 06:40:27 (UTC+0)
signal strength 3 of 5
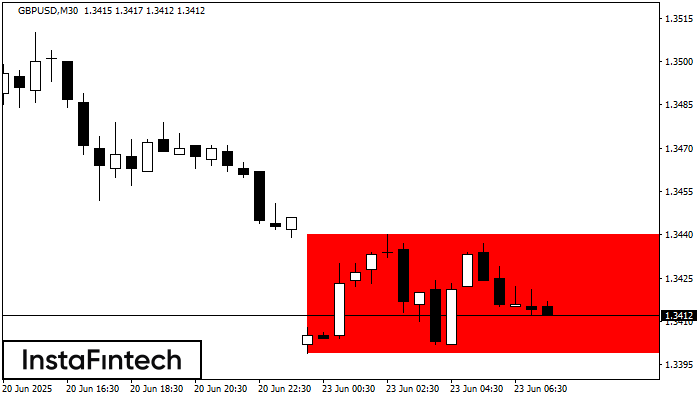
According to the chart of M30, GBPUSD formed the Bearish Rectangle which is a pattern of a trend continuation. The pattern is contained within the following borders: lower border 1.3399 – 1.3399 and upper border 1.3440 – 1.3440. In case the lower border is broken, the instrument is likely to follow the downward trend.
Lihat juga
- All
- All
- Bearish Rectangle
- Bearish Symmetrical Triangle
- Bearish Symmetrical Triangle
- Bullish Rectangle
- Double Top
- Double Top
- Triple Bottom
- Triple Bottom
- Triple Top
- Triple Top
- All
- All
- Buy
- Sale
- All
- 1
- 2
- 3
- 4
- 5
Teratas Ganda
was formed on 28.07 at 14:15:20 (UTC+0)
signal strength 2 of 5
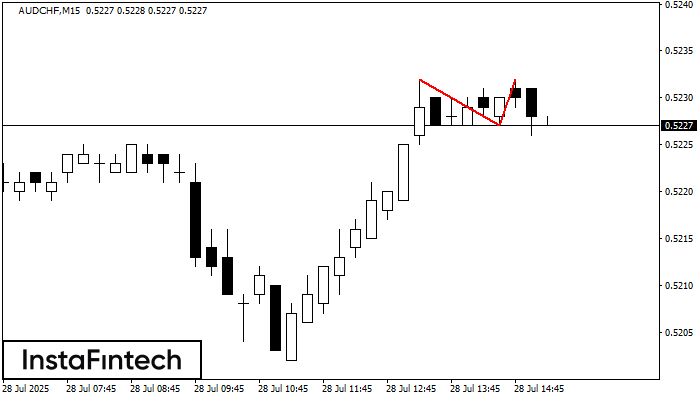
Pada grafik AUDCHF M15 pola reversal Teratas Ganda telah terbentuk. Karakteristik: batas atas 0.5232; batas bawah 0.5227; lebar pola 5 poin. Sinyal: tembusan ke batas bawah akan menyebabkan kelanjutan tren
Rangka waktu M5 dan M15 mungkin memiliki lebih dari titik entri yang keliru.
Open chart in a new window
Bawah Ganda
was formed on 28.07 at 13:59:53 (UTC+0)
signal strength 2 of 5
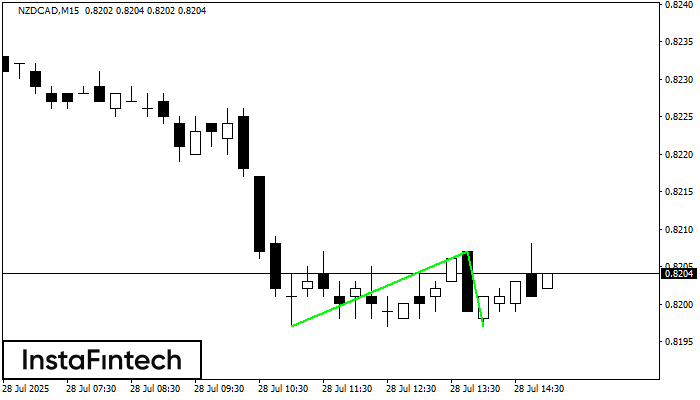
Pola Bawah Ganda telah terbentuk pada NZDCAD M15; batas atas di 0.8207; batas bawah di 0.8197. Lebar pola sebesar 10 poin. Jika harga menembus batas atas 0.8207, Perubahan dalam tren
Rangka waktu M5 dan M15 mungkin memiliki lebih dari titik entri yang keliru.
Open chart in a new window
Bawah Ganda
was formed on 28.07 at 13:20:09 (UTC+0)
signal strength 1 of 5
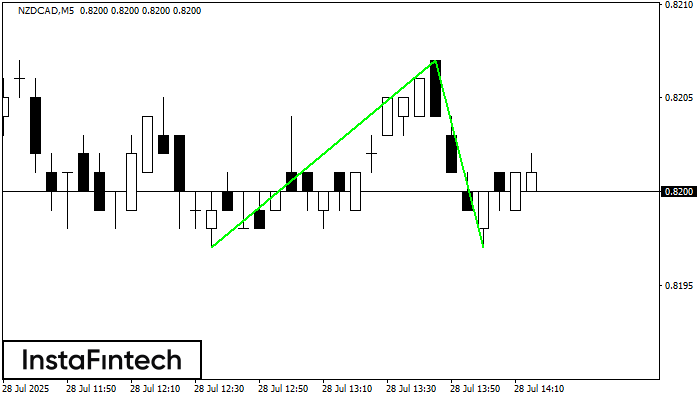
Pola Bawah Ganda telah terbentuk pada NZDCAD M5. Karakteristik: level support 0.8197; level resistance 0.8207; lebar pola 10 poin. Jika level resistance ditembus, perubahan dalam tren dapat diprediksi dengan target
Rangka waktu M5 dan M15 mungkin memiliki lebih dari titik entri yang keliru.
Open chart in a new window