Pola sebenarnya

Bearish pennant
was formed on 23.06 at 17:15:20 (UTC+0)
signal strength 2 of 5
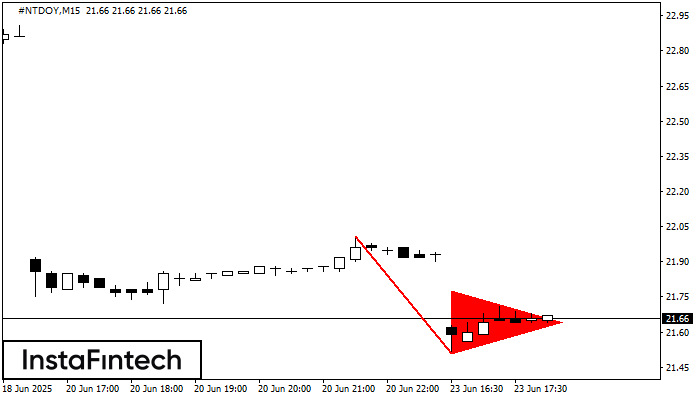
The Bearish pennant pattern has formed on the #NTDOY M15 chart. It signals potential continuation of the existing trend. Specifications: the pattern’s bottom has the coordinate of 21.51; the projection of the flagpole height is equal to 50 pips. In case the price breaks out the pattern’s bottom of 21.51, the downtrend is expected to continue for further level 21.28.
The M5 and M15 time frames may have more false entry points.
- All
- All
- Bearish Rectangle
- Bearish Symmetrical Triangle
- Bearish Symmetrical Triangle
- Bullish Rectangle
- Double Top
- Double Top
- Triple Bottom
- Triple Bottom
- Triple Top
- Triple Top
- All
- All
- Buy
- Sale
- All
- 1
- 2
- 3
- 4
- 5
Panji Bearish
was formed on 25.07 at 14:30:08 (UTC+0)
signal strength 2 of 5

Pola Panji Bearish telah terbentuk di grafik GBPAUD M15. Pola ini memberikan sinyal potensi kelanjutan tren yang ada. Spesifikasi: titik terendah pola berkoordinat di 2.0468; proyeksi titik tertinggi sama dengan
Rangka waktu M5 dan M15 mungkin memiliki lebih dari titik entri yang keliru.
Open chart in a new window
Bawah Ganda
was formed on 25.07 at 14:00:19 (UTC+0)
signal strength 2 of 5

Pola Bawah Ganda telah terbentuk pada NZDUSD M15; batas atas di 0.6010; batas bawah di 0.6000. Lebar pola sebesar 11 poin. Jika harga menembus batas atas 0.6010, Perubahan dalam tren
Rangka waktu M5 dan M15 mungkin memiliki lebih dari titik entri yang keliru.
Open chart in a new window
Kepala dan Bahu Terbalik
was formed on 25.07 at 13:55:30 (UTC+0)
signal strength 1 of 5

Menurut grafik dari M5, AUDCHF membentuk pola Kepala dan Bahu Terbalik. Puncak kepala (Head) ditetapkan di 0.5232 sementara garis median leher (Neck) ditemukan di 0.5224/0.5229. Formasi pola Kepala dan Bahu
Rangka waktu M5 dan M15 mungkin memiliki lebih dari titik entri yang keliru.
Open chart in a new window