यह भी देखें

 09.05.2025 07:01 PM
In my morning forecast, I drew attention to the 1.1257 level and planned to base entry decisions around it. Let's look at the 5-minute chart and analyze what happened there. A rise followed by a false breakout near 1.1257 led to an entry point for selling the euro, but the pair only moved downward by 15 points. The technical picture was revised for the second half of the day.
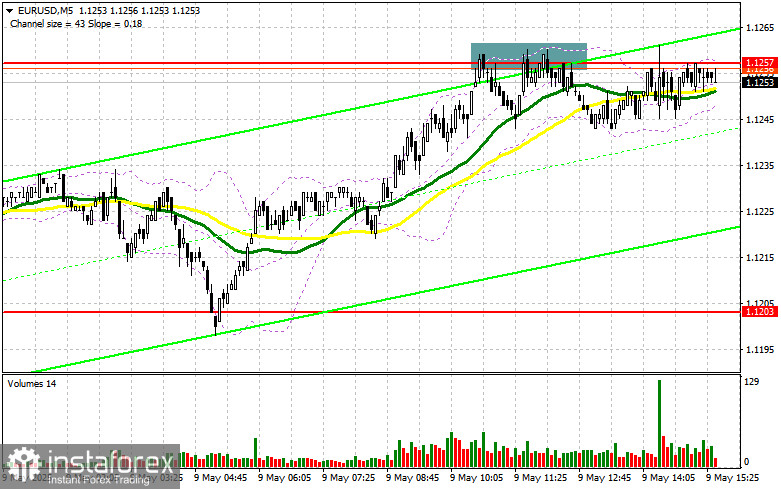
In the second half of the day, the only events on the calendar are speeches by FOMC members John Williams and Christopher Waller. Their comments could trigger a larger correction in the pair, but that would require bold statements regarding rate cuts as early as this summer. If the euro declines, the focus will shift to defending new support at 1.1239, which was formed in the first half of the day. A false breakout there, similar to the one described earlier, will be a signal to buy EUR/USD in anticipation of a market recovery toward 1.1277. A breakout and retest of this range will confirm the entry point, with a target of 1.1319. The furthest target will be 1.1376, where profits should be taken.
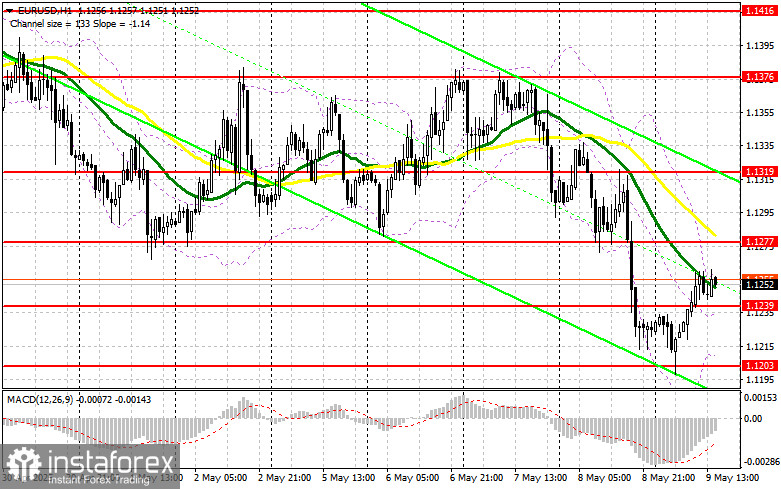
If EUR/USD falls and shows no buyer activity around 1.1239, the pressure on the pair will intensify by week's end, possibly pushing it lower. In that case, bears may aim for 1.1203. Only after a false breakout there will I consider buying the euro. Alternatively, I'll look to buy on a rebound from the 1.1150 support area with a target of 30–35 points intraday correction.
Sellers have not shown much enthusiasm so far. If the euro rises after the U.S. officials' speeches—as seems likely—bears will have to prove themselves around 1.1277, where the moving averages are also supporting sellers. Only a false breakout there will justify entering short positions, targeting support at 1.1239. A breakout and consolidation below that range will offer a solid selling opportunity with a path to 1.1203. The final target will be the 1.1150 level, where profits should be taken.
If EUR/USD moves upward in the second half of the day and there's no seller resistance at 1.1277, buyers could push for a larger correction and a test of 1.1319. I'll consider shorting only after a failed consolidation there. If the pair rises further, I'll look to open shorts from the 1.1376 level, targeting a 30–35 point correction.
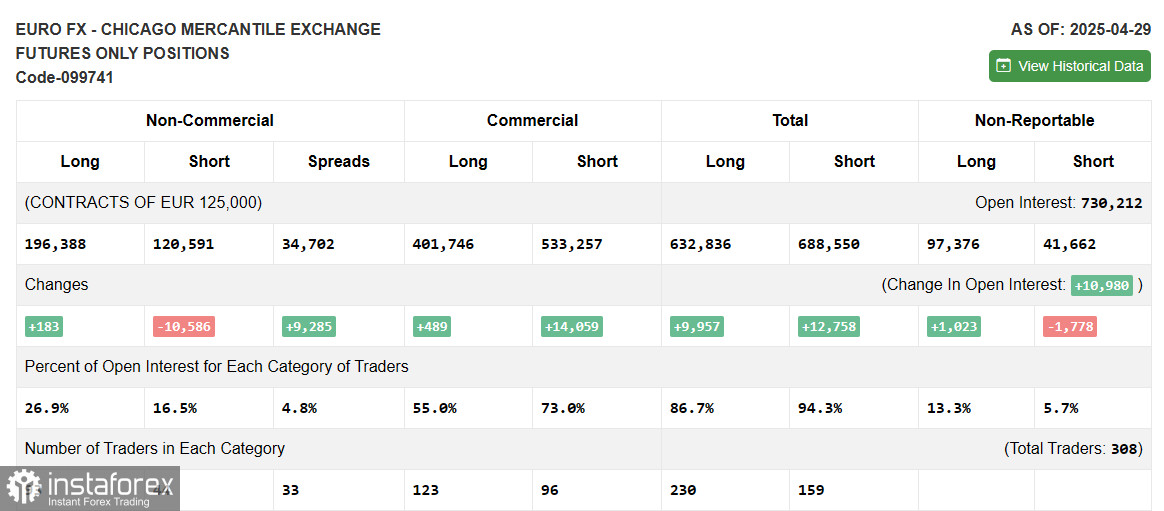
The April 29 COT report showed an increase in long positions and a decrease in shorts. Since the ECB plans to continue cutting interest rates, this remains a limiting factor for a bullish euro market. An upcoming Fed meeting is expected to keep borrowing costs unchanged, which favors the U.S. dollar and continues to support it. According to the COT data, long non-commercial positions rose by 183 to 196,388, while short non-commercial positions fell by 10,586 to 120,591. As a result, the gap between longs and shorts widened by 9,285.
Moving Averages: Trading is occurring below the 30- and 50-period moving averages, indicating further downside pressure.
Note: The moving average periods and prices are based on the author's H1 chart and differ from classical daily averages on the D1 chart.
Bollinger Bands: In case of a decline, the lower band of the indicator around 1.1203 will act as support.

