यह भी देखें

 13.05.2025 07:30 AM
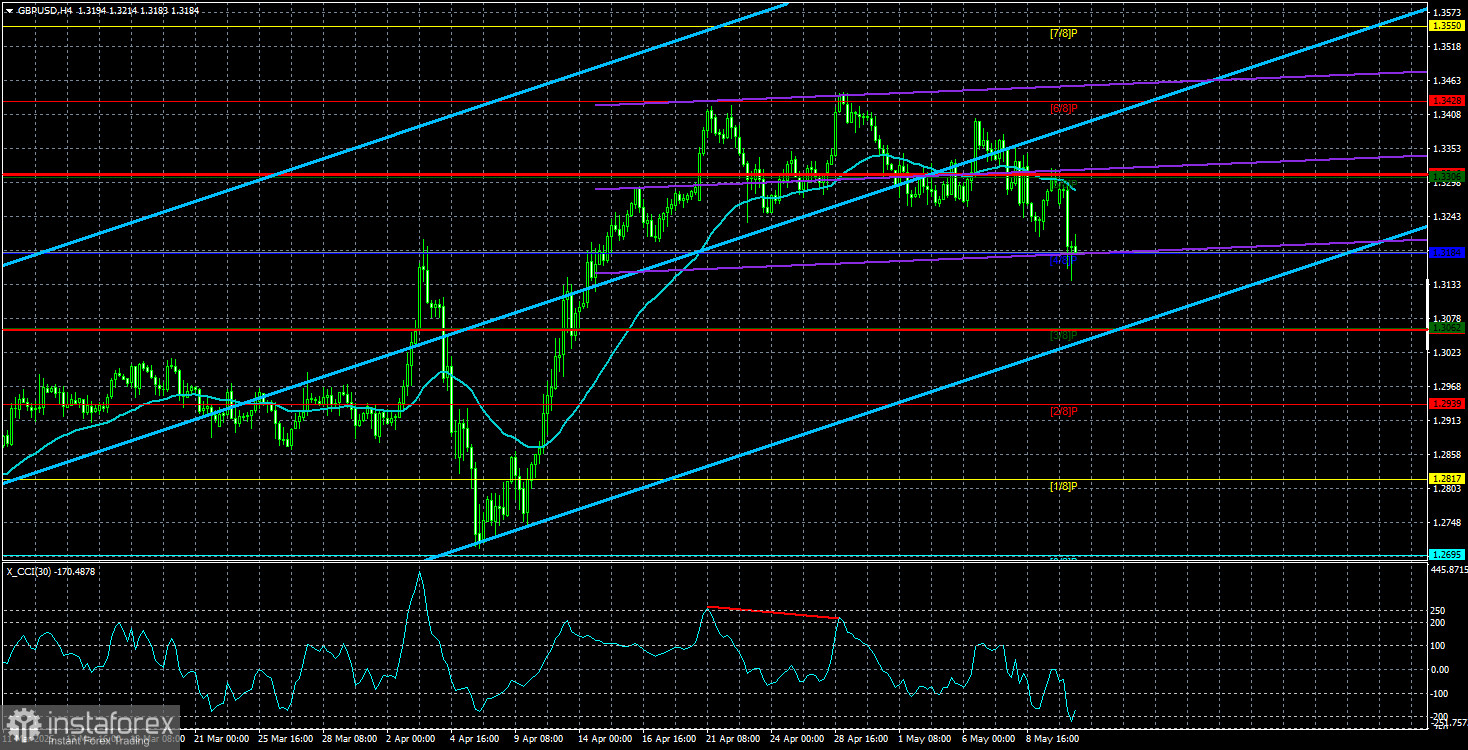
The GBP/USD currency pair plummeted rapidly on Monday. The U.S., represented by Treasury Secretary Scott Bessent, announced the first signs of progress in trade negotiations with China. Following a bilateral meeting in Switzerland, Beijing and Washington agreed to reduce tariffs by 115%. This news sent the market rushing to buy the U.S. dollar.
The future path of GBP/USD mirrors that of EUR/USD. If the de-escalation process continues and Trump's team keeps signing trade agreements with countries previously targeted by tariffs, the dollar will keep strengthening. The trade war had been the sole reason for the dollar's decline in recent months, and now the de-escalation of that war is the only reason for its rise. Only after the conflict officially ends will the market focus on macroeconomic and fundamental data, which are currently being overlooked. When that time comes, the British pound may be in trouble.
Let's recall that the dollar has had reasons to strengthen all along, but the market dismissed the positive backdrop in the U.S. The British economy remains weak, and its macroeconomic indicators are no stronger than those of the U.S., and the Bank of England has already cut its key interest rate twice in 2025, unlike the Federal Reserve. These factors alone suggest that the dollar will continue to rise against the pound once the trade war ends.
To understand where the pair might be heading in 2025 under favorable conditions for the dollar, one should look at the weekly time frame. It clearly shows that the dollar met Trump's presidency around the 1.2300 level and was preparing to resume a 16-year-long uptrend. Therefore, the pair's first target should be a return to the 1.23–1.24 zone—quite realistic if trade deals are signed with all or most of the countries on Trump's "blacklist."
Beyond that, the market will remember that the Fed maintains a rate close to its peak, even though the entire monetary easing cycle has already been priced multiple times. The market will realize that the U.S. economy is once again poised for growth and expansion, unlike the British one. We had been forecasting a fall in the British pound three months ago, but Trump's trade war interfered with that outlook. If the trade war ends, what else can we expect from the pound except another decline? Even now, on the weekly time frame, it's evident that the entire rally from September 2022 to today has been just a correction within a global downtrend—and that downtrend is not over.
It is important to remember that Trump can bring surprises—some of which may not be well received by traders, the dollar, or the U.S. economy. Therefore, as before, everything hinges on the American president.
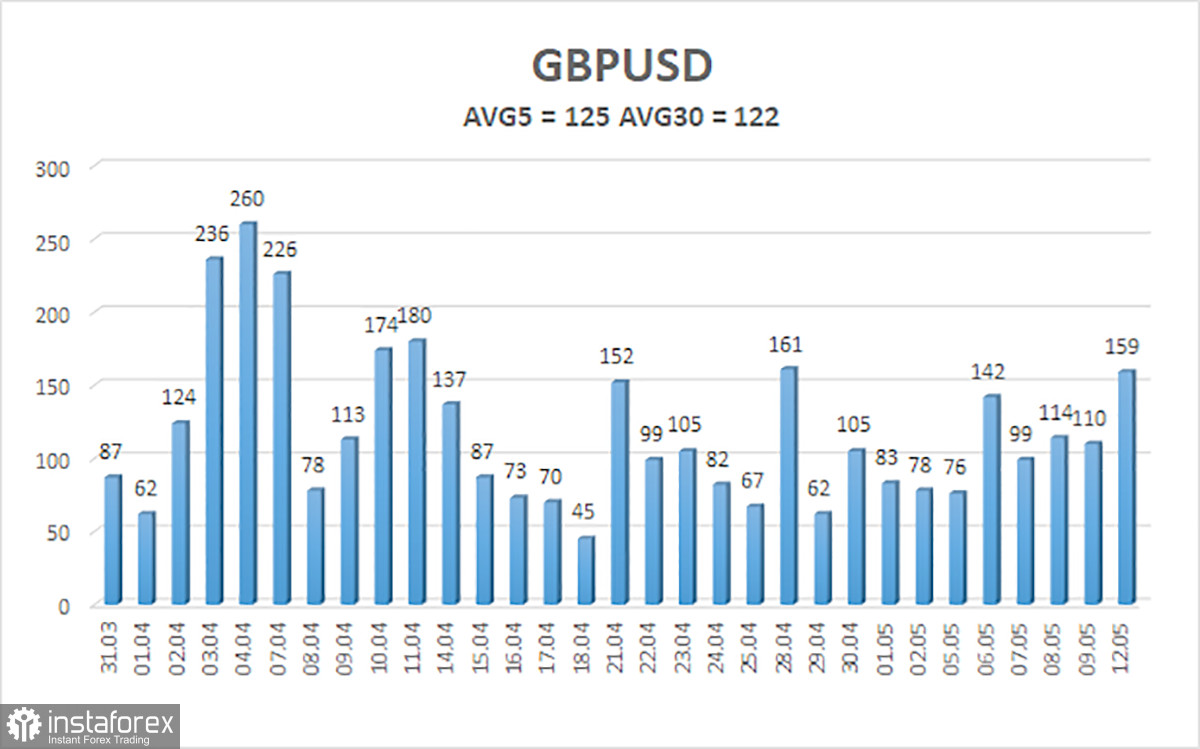
The average volatility of GBP/USD over the last five trading days is 125 pips, which is considered high for this pair. On Tuesday, May 13, we expect the pair to move within a range defined by 1.3060 and 1.3310. The long-term regression channel remains upward, indicating a continued bullish trend. The CCI indicator has formed a bearish divergence, which triggered the most recent decline.
S1 – 1.3184
S2 – 1.3062
S3 – 1.2939
R1 – 1.3306
R2 – 1.3428
R3 – 1.3550
The GBP/USD pair maintains a bullish trend but has resumed a correction following the trade agreement breakthrough between China and the U.S. We still believe there are no valid reasons for the pound to rise. If the de-escalation of the trade conflict continues—as appears likely—the dollar may quickly return to the 1.2300–1.2400 range, from which its decline began amid Trump's tariff war.
Thus, under the current circumstances, long positions are not considered relevant. Short positions remain attractive, especially if the price stays below the moving average. Initial targets are 1.3062 and 1.2939.
Linear Regression Channels help determine the current trend. If both channels are aligned, it indicates a strong trend.
Moving Average Line (settings: 20,0, smoothed) defines the short-term trend and guides the trading direction.
Murray Levels act as target levels for movements and corrections.
Volatility Levels (red lines) represent the likely price range for the pair over the next 24 hours based on current volatility readings.
CCI Indicator: If it enters the oversold region (below -250) or overbought region (above +250), it signals an impending trend reversal in the opposite direction.

