यह भी देखें

 23.05.2025 04:49 PM
On the evening of May 22, 2025, a unique event took place at the Trump National Golf Club in Virginia — a dinner hosted by Donald Trump with the largest holders of the Official Trump (TRUMP) token. The event was attended by 220 participants selected via wallet connection to the project's website.
During the event, Trump reaffirmed his commitment to supporting the crypto industry in the US. "The US must become the world capital of cryptocurrency," he stated. Trump gave a speech but left without personally interacting with the guests, which disappointed some attendees.
While cryptocurrencies were being discussed inside, around 100 protesters gathered at the entrance, chanting: "Shame!", "America is not for sale!", and "Meme coin scammers — go to jail!"
Current TRUMP token performance (as of 12:30 GMT, May 23):
Price: $13.90
24h decline: –4.8%
From all-time high ($73): –81%
The dinner with crypto investors cemented Trump's ties with the crypto community and served as an example of political lobbying through digital assets.
The event raises questions about the transparency of memecoins and their role in election campaigns. Despite the controversies, interest in the TRUMP token remains strong, and the US is inching closer to becoming a political-crypto battleground.
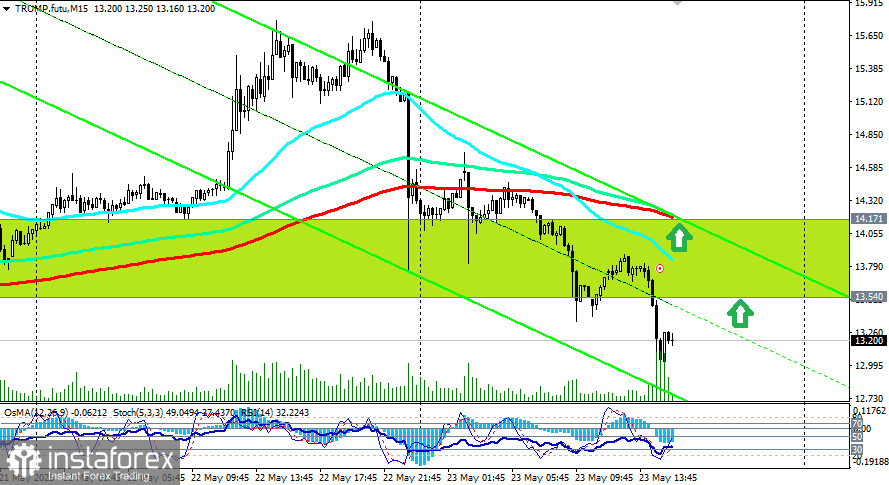
From a technical viewpont, below the key resistance level of 19.25 (200 EMA on the daily chart), the TRUMP token is trading in a medium-term bearish market zone. Currently, after breaking the support level at 13.54 (200 EMA on the 1-hour chart), TRUMP is moving down toward another critical support level at 12.47 (200 EMA on the 4-hour chart and 50 EMA on the daily chart).
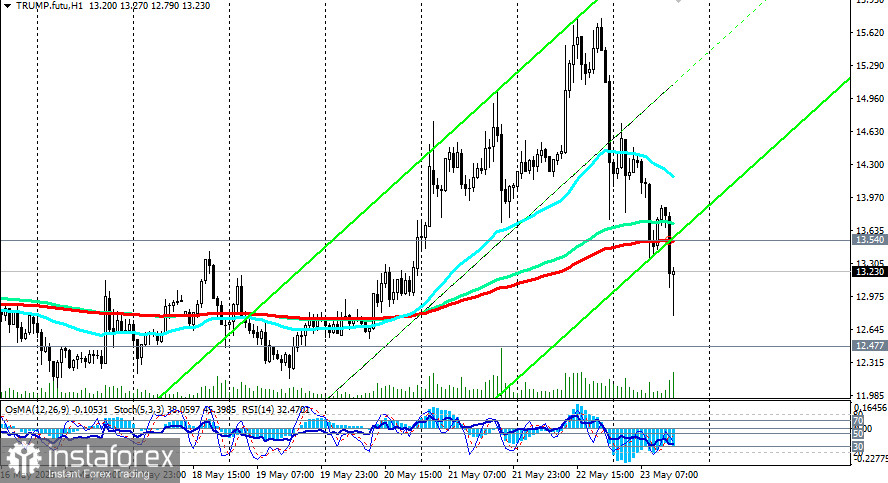
Given the overall upward trend and positive momentum across the cryptocurrency market, new buy orders can be considered from current levels and around 12.47, especially if the US dollar continues to weaken.
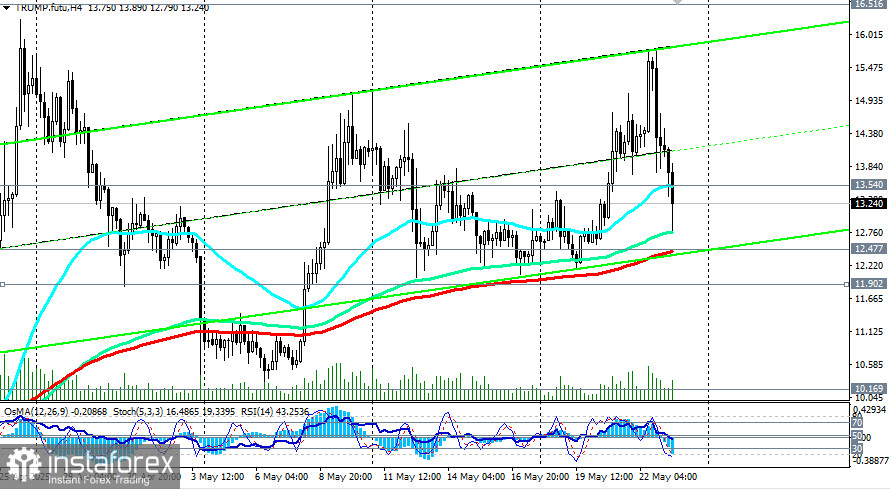
The upside target for TRUMP is the resistance level of 16.52 (144 EMA on the daily chart). A breakout above the key level of 19.25 would push the token into a medium-term bullish market zone, restoring preference for long positions in the medium term.
In an alternative scenario, further decline and a breakdown below the critical support level of 12.47 would push the price back into the descending channel on the daily chart and back into bearish territory.
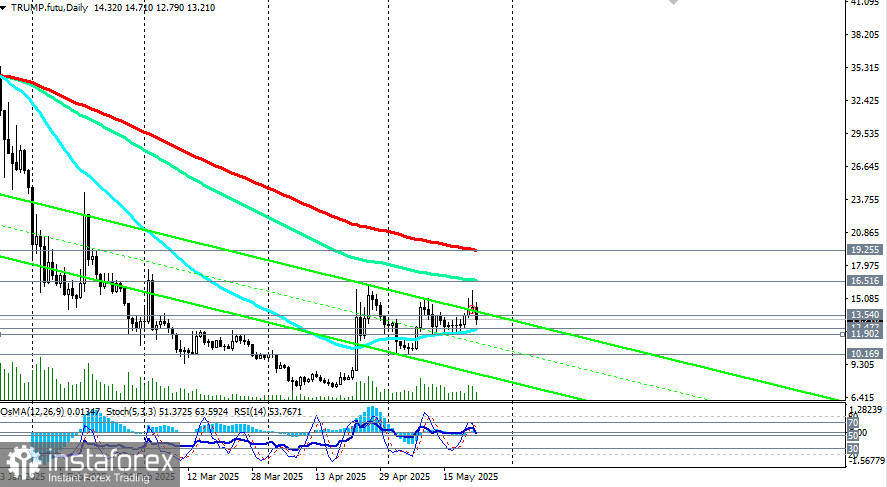
Support levels: 12.47, 12.00, 10.17, 8.00, 7.20, 7.00 Resistance levels: 13.54, 16.51, 19.00, 19.25
Trading Scenarios:
Primary scenario:
Buy Stop: 13.55
Buy Limit: 12.50
Stop Loss: 11.80
Targets: 15.00, 16.00, 16.51, 19.00, 19.25, 20.00, 22.00, 28.00, 28.15, 29.00
Alternative scenario:
Sell Stop: 11.80
Stop Loss: 12.55
Targets: 11.00, 10.00, 8.00, 7.00
*) The listed Targets correspond to support/resistance levels. They are not guaranteed to be reached, but may serve as reference points when planning and placing trading positions.

