यह भी देखें

 04.06.2025 09:10 AM
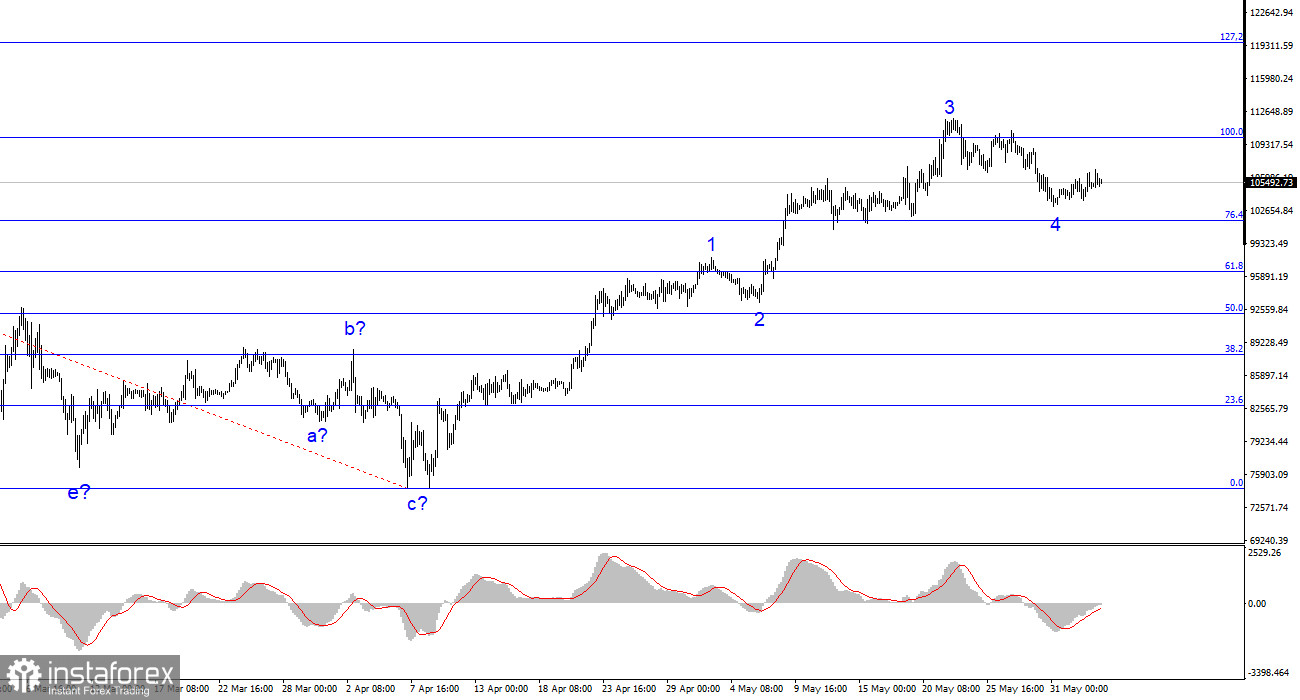
The wave pattern on the 4-hour chart for BTC/USD has become more complex. We observed a corrective downward structure that completed its formation around the $75,000 level. After that, a rather strong rise began, which could be an impulsive upward trend. The second wave of this segment appeared very small and quite unconvincing, but demand for Bitcoin continues to grow, signaling a "pump." It's worth noting that corrective three-wave structures can take absolutely any form. I do not rule out that such a structure has already been completed and a new decline in Bitcoin may be ahead.
The news background supports Bitcoin, but not always and not consistently. I would say that market participants themselves interpret any news in favor of the leading cryptocurrency — or simply ignore the news flow and just buy. We are observing the formation of a new upward trend segment based on emotions, demand, and belief in Bitcoin's sky-high future value. One way or another, Trump's tariffs and the risks of an economic slowdown no longer scare cryptocurrency traders. Previously, they triggered a flight from risk assets; now Bitcoin serves as a "safe haven from Trump's policies."
The BTC/USD exchange rate has risen significantly over the past eight weeks, with steady and consistent demand growth. Only in the last couple of weeks have we seen a corrective wave. Following the impulsive wave pattern, another fifth wave is still expected — and it could mark the end of the trend. Of course, no one knows yet how strong the fifth wave will be, or whether it will occur at all. No one knows how strong the next downward structure will be either. However, the current wave picture doesn't look too favorable for buyers. Their advantage is undeniable, but they have failed three times to push Bitcoin above the $110,000 level.
The news background over recent weeks cannot be called weak. Let me remind you that in the first two months of Trump's presidency, demand for Bitcoin only decreased. Many linked this decline to fears of an economic slowdown, complete economic uncertainty, and the trade war. However, after two months of turmoil, the market began to recover rapidly — something that cannot be explained by news, as the trade war hasn't de-escalated. Trump gave three months to the countries he imposed tariffs on — and so far, this has led nowhere. Only one trade deal — with the United Kingdom — has been reached, and according to media reports, it has not even been signed yet.
Thus, the economic situation has not become any "clearer," the prospects for the U.S. economy have not improved, and Trump's latest statements suggest the possibility of renewed escalation.
Based on the BTC/USD analysis, I conclude that the upward wave structure continues to build, but it has a very strange nature and foundation. The news background has not caused Bitcoin's sharp rise, and around the $110,000 level, buyers are running out of strength for the third time in a row. If we abstract away from wave analysis, I would say that a new downward trend segment is being prepared. In the near future, a decline toward $101,500 is possible, corresponding to the 76.4% Fibonacci retracement level.
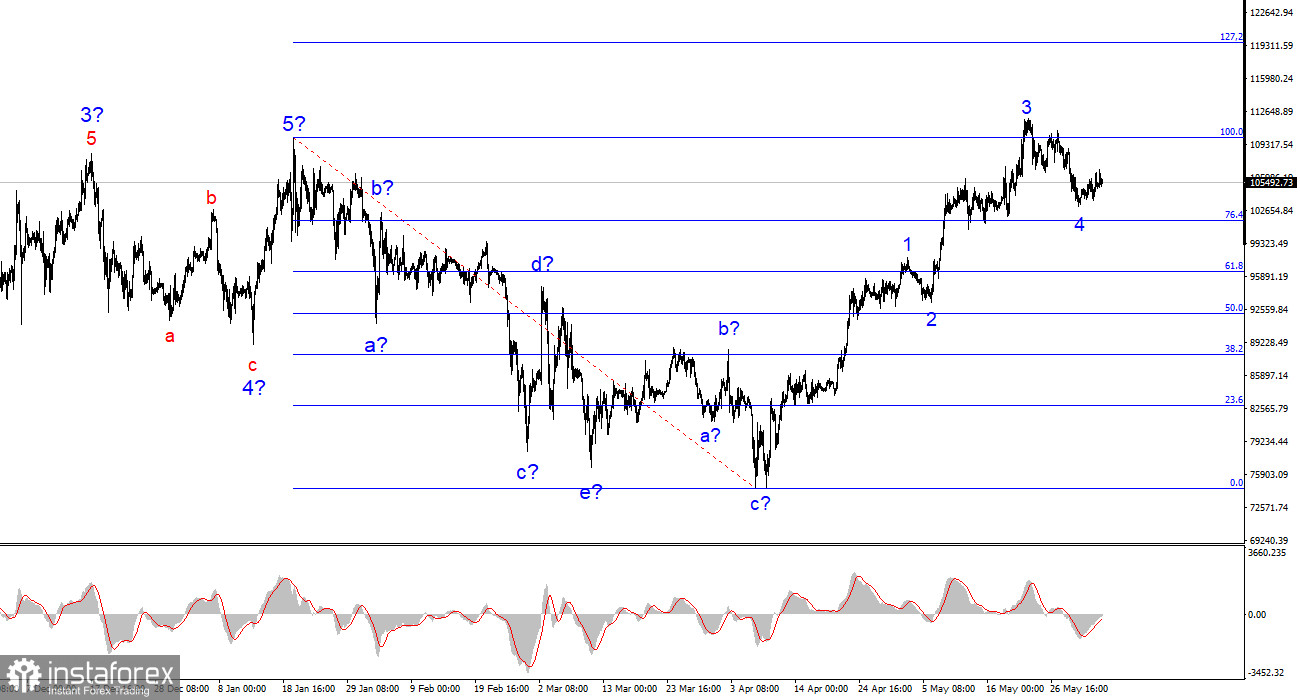
On a larger wave scale, the upward trend segment continues to form, but its internal wave structure is very ambiguous due to the near absence of corrective waves.
The Main Principles of My Analysis:

