यह भी देखें

 16.06.2025 10:27 AM
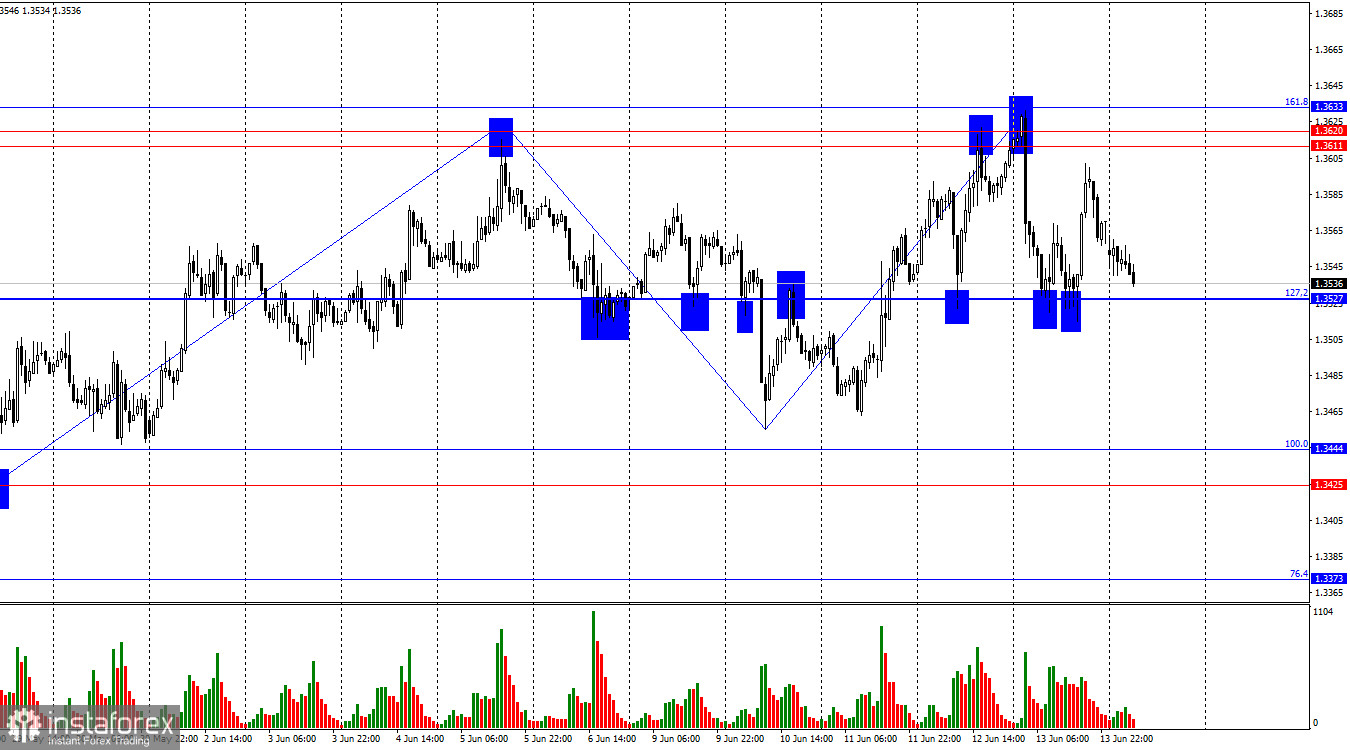
On the hourly chart, the GBP/USD pair on Friday rebounded twice from the 127.2% Fibonacci retracement level at 1.3527 and rose toward the resistance zone of 1.3611–1.3633. However, prior to that, it had rebounded from this resistance zone and sharply dropped back to 1.3527. Therefore, another rebound from the 1.3527 level today would favor the pound and another bullish attack toward the 1.3611–1.3633 level. A consolidation below 1.3527 would indicate bulls are retreating and allow bears to aim for the support zone at 1.3425–1.3444.
The wave structure clearly indicates the continuation of a bullish trend. The last upward wave broke the previous peak, and the last downward wave failed to break the prior low. Bulls will find it difficult to sustain further growth without new negative news for the dollar. However, the U.S. president remains prepared to raise tariffs, combat immigration, and pressure China and other tariff-targeted nations. This gives bulls grounds for further attacks — but fresh catalysts are needed. The bullish trend will be considered over only after a close below 1.3455.
On Friday, bears received unexpected support not from the economy, but from politics. Israel and Iran reignited military conflict, which temporarily supported dollar bulls. However, the 1.3527 level held firm against their pressure, and the economic backdrop had no effect on trader sentiment that day. Over the weekend, many traders expected new military actions from either Iran or Israel, but it now appears the parties may reach some form of agreement under U.S. mediation. Clearly, this is not the end of the longstanding conflict, but military operations and missile attacks should cease. Iran cannot withstand pressure from both Israel and the U.S. Trump has threatened continued strikes on military and nuclear facilities, which Iran's defenses cannot withstand against advanced missiles and other weaponry. As a result, dollar bulls did not get the further escalation they had hoped for.
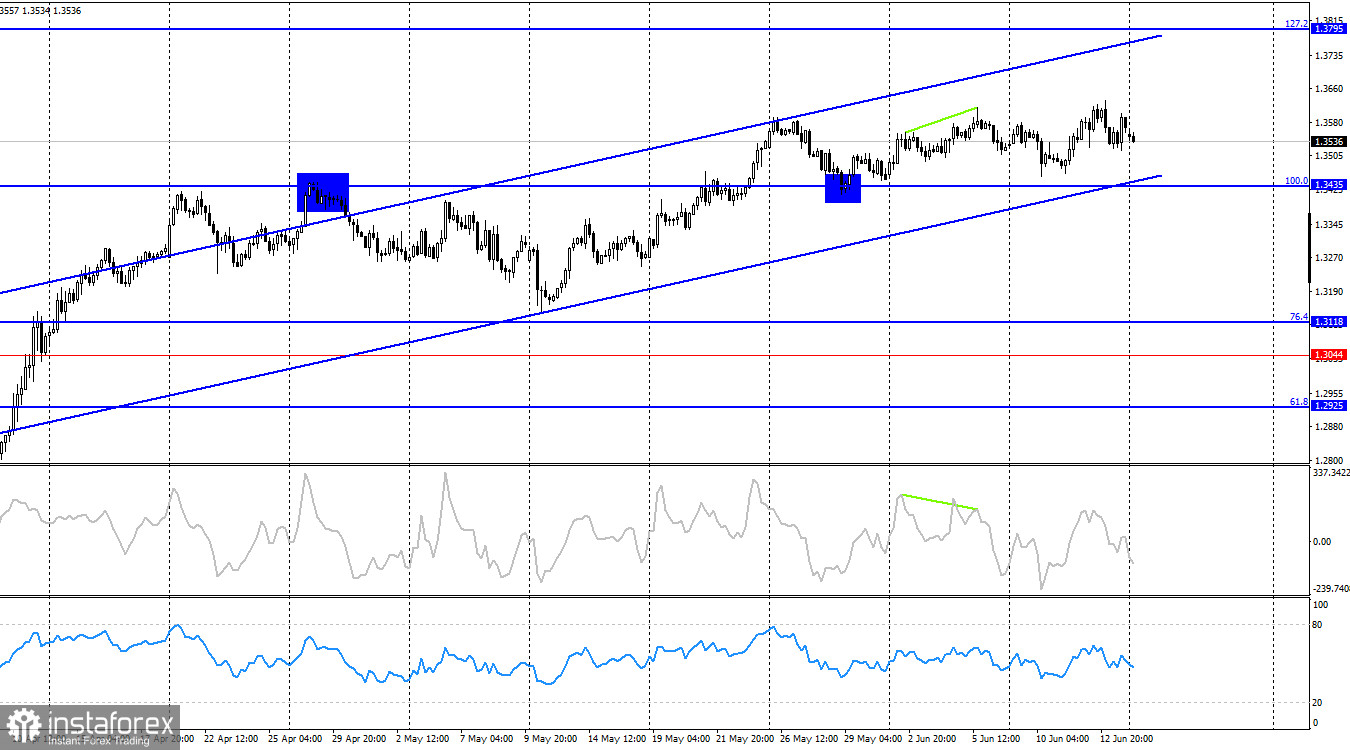
On the 4-hour chart, the pair has consolidated above the 100.0% Fibonacci level at 1.3435 and then rebounded from it. Growth may continue toward the 127.2% level at 1.3795, whether following another bounce from 1.3435 or without it. The bullish trend currently shows no signs of reversal, but a close below 1.3435 would open the way for a decline toward the 76.4% level at 1.3118. No emerging divergences are currently seen on any indicator.
Commitments of Traders (COT) Report:
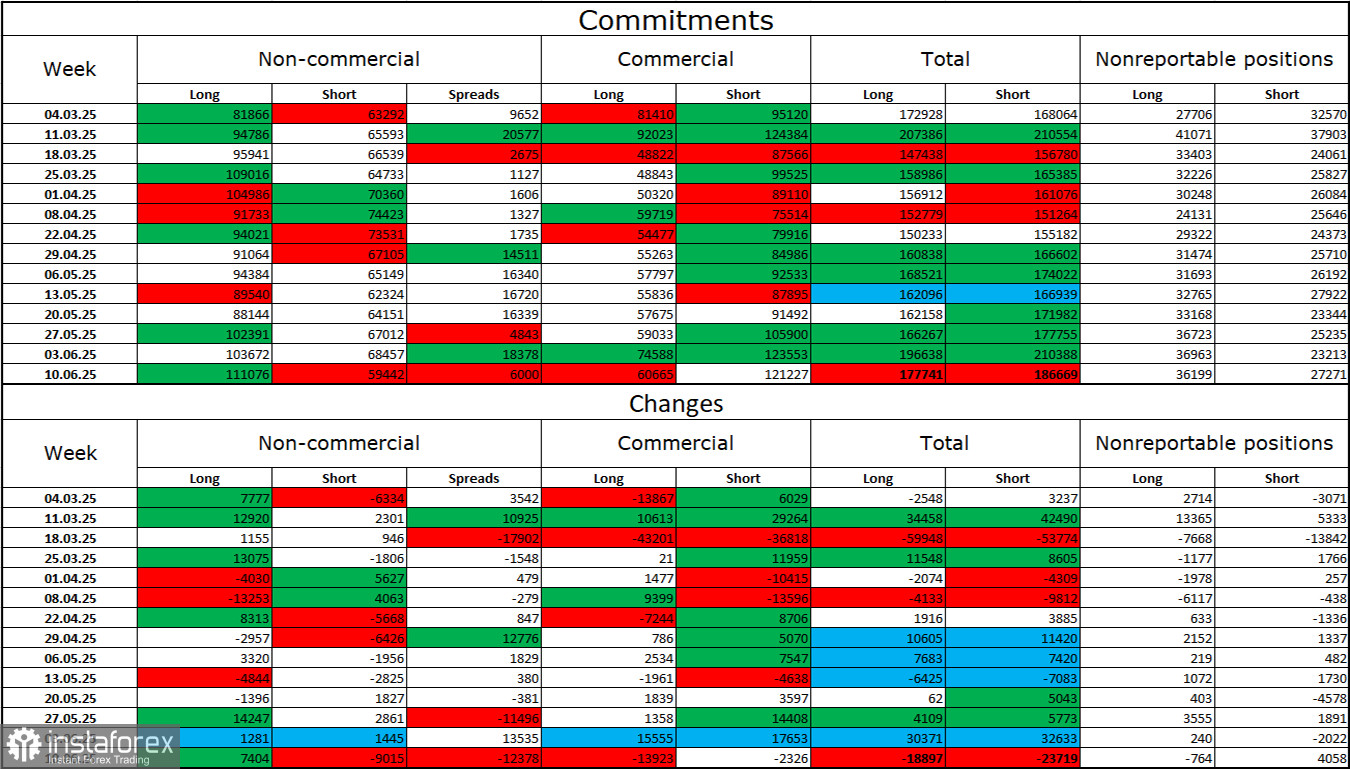
Sentiment among the "Non-commercial" category of traders became significantly more bullish in the most recent reporting week. The number of long positions held by speculators increased by 7,404, while short positions dropped by 9,015. Bears have long lost their advantage in the market and currently have no prospects for success. The gap between long and short positions stands at 51,000 in favor of the bulls: 111,000 vs. 59,000.
In my opinion, the pound still faces downside risks, but recent developments have shifted the market outlook in the long term. Over the past three months, the number of long positions has risen from 65,000 to 111,000, while short positions have declined from 76,000 to 59,000. Under Donald Trump, confidence in the dollar has weakened, and COT reports reflect a lack of interest among traders in buying the dollar. Thus, regardless of the broader news landscape, the dollar continues to fall amid events surrounding Donald Trump.
Economic Calendar for the U.S. and UK:
On Monday, the economic calendar contains no significant entries. Therefore, the news background will not influence trader sentiment for the rest of the day — at least not from economic data. However, headlines related to the Iran–Israel conflict may still emerge throughout the day.
GBP/USD Forecast and Trader Recommendations:
Selling the pair was possible after a rebound from the 1.3611–1.3620 resistance zone with a target at 1.3527 — which was achieved. Today, selling is possible after a close below 1.3527 with a target at 1.3444. Buying is advisable after a rebound from 1.3527 with a target at the 1.3611–1.3633 resistance zone.
Fibonacci grids are built from 1.3446–1.3139 on the hourly chart and from 1.3431–1.2104 on the 4-hour chart.

