यह भी देखें

 16.06.2025 12:02 PM
On Friday, the EUR/USD pair reversed in favor of the U.S. dollar and consolidated below the 100.0% Fibonacci correction level at 1.1574. This did not happen without reason, which we will discuss below. The consolidation below 1.1574 opens the door for a continued decline toward the next Fibonacci level at 76.4% — 1.1454. A return above 1.1574 would once again allow for expectations of euro growth toward the 1.1645 and 1.1712 levels.
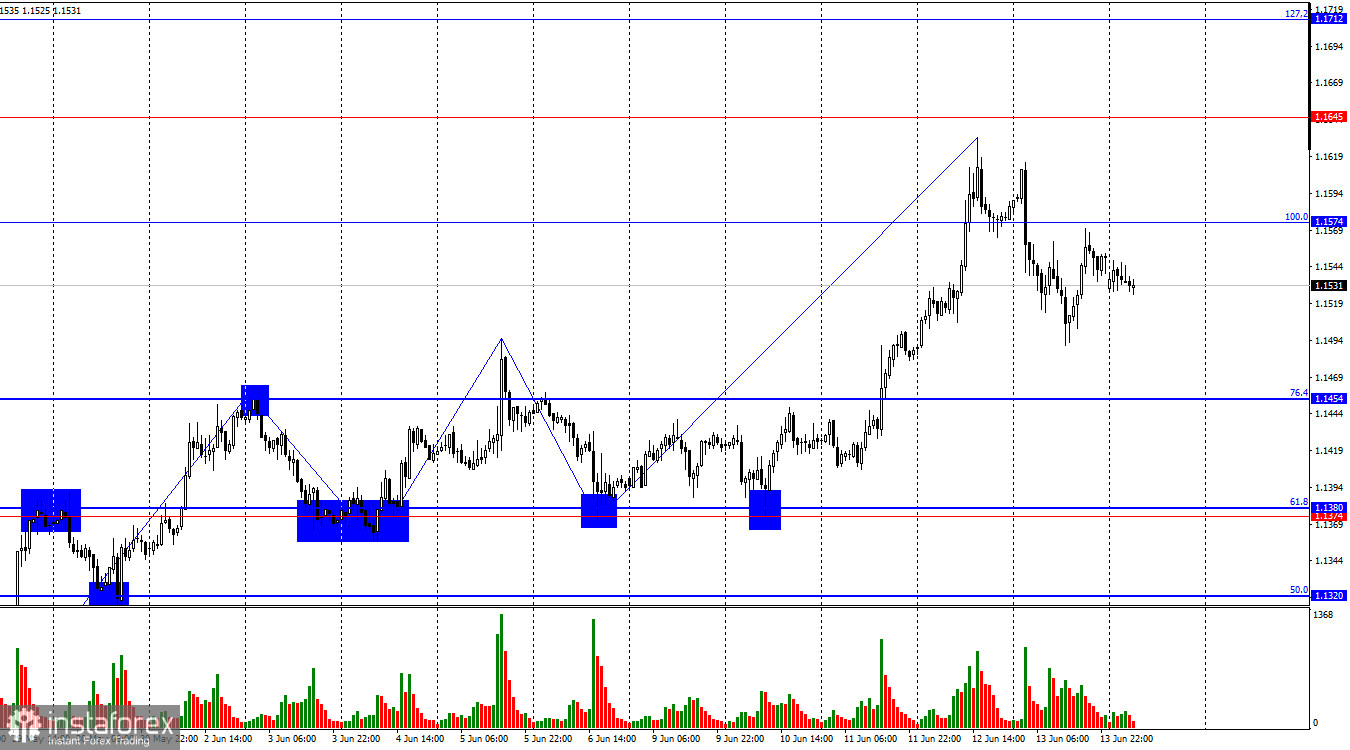
On the hourly chart, the wave structure remains obvious. The most recent downward wave failed to break the previous low, while the latest upward wave easily surpassed the previous high. Therefore, the trend remains "bullish" for now. Recent news on the increase in tariffs on steel and aluminum forced the bears to retreat again, and the lack of real progress in U.S.–China trade talks is keeping them from launching fresh attacks. The trend would shift to "bearish" only if the pair consolidates below the 1.1374–1.1380 zone.
Friday's news background can be roughly divided into economic and political. Among the economic data, it's not Germany's inflation or Eurozone industrial production that stood out — these did not support the euro — but rather the U.S. consumer sentiment index, which unexpectedly jumped by almost 10 points, far beyond expert expectations. However, bears launched their offensive only Friday night, prompted by Israel's sudden missile strike on Iran, which destroyed several nuclear and military sites. As it turned out, this was not the final attack — Iran responded with strikes on Israel the next day.
Donald Trump also got involved in the conflict, demanding that Iran sign an agreement to cease uranium enrichment and the production of nuclear missiles. According to him, Tehran had two months to sign the deal but refused to meet the U.S. terms. Trump is now pushing for a new agreement with Israel, though the demands remain the same. The new escalation in the Middle East gave short-lived support to the bears. For traders, however, "trade skirmishes" and internal U.S. issues currently hold more weight.
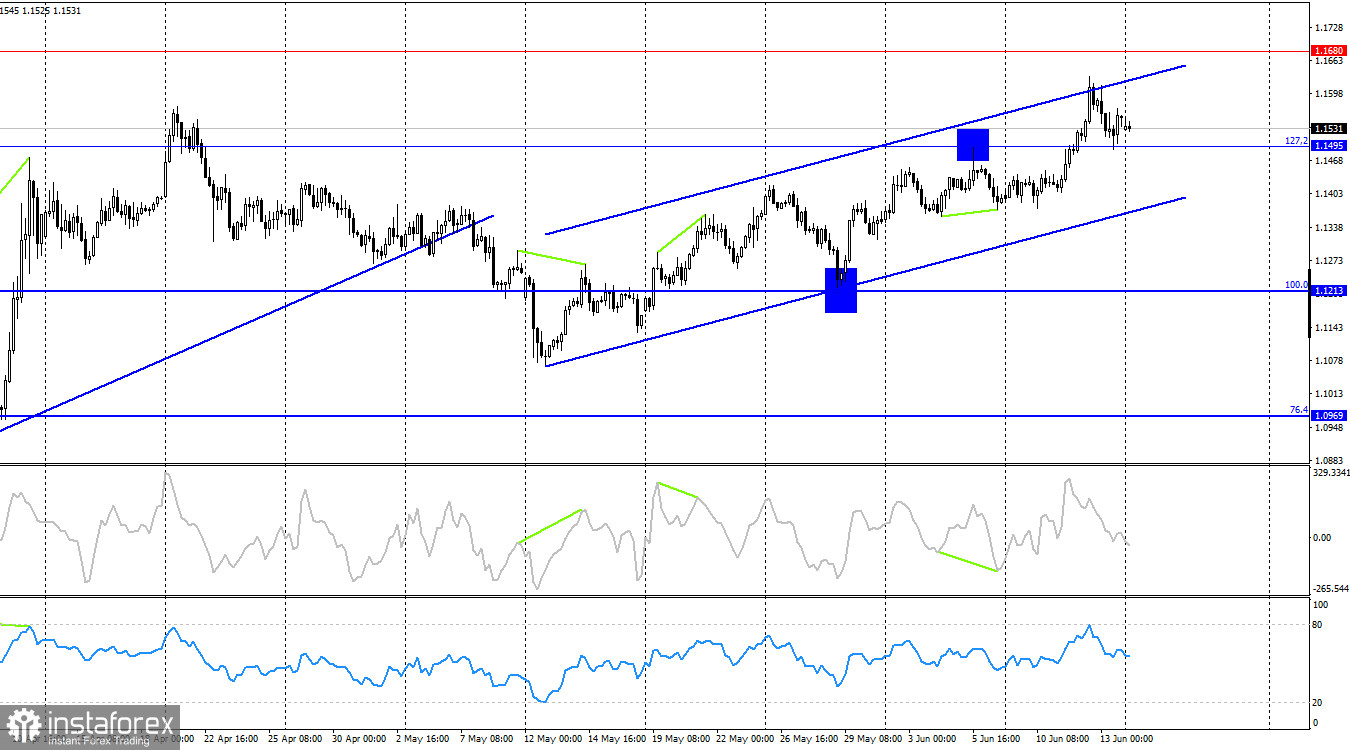
On the 4-hour chart, the pair has consolidated above the 127.2% Fibonacci corrective level at 1.1495. Therefore, the euro's upward movement could continue toward the next level at 1.1680. The upward channel clearly indicates the continuation of the "bullish" trend. A drop below 1.1495 would signal a possible reversal in favor of the U.S. currency and a decline toward the lower boundary of the channel. There are no emerging divergences from any indicator at this time.
Commitments of Traders (COT) Report
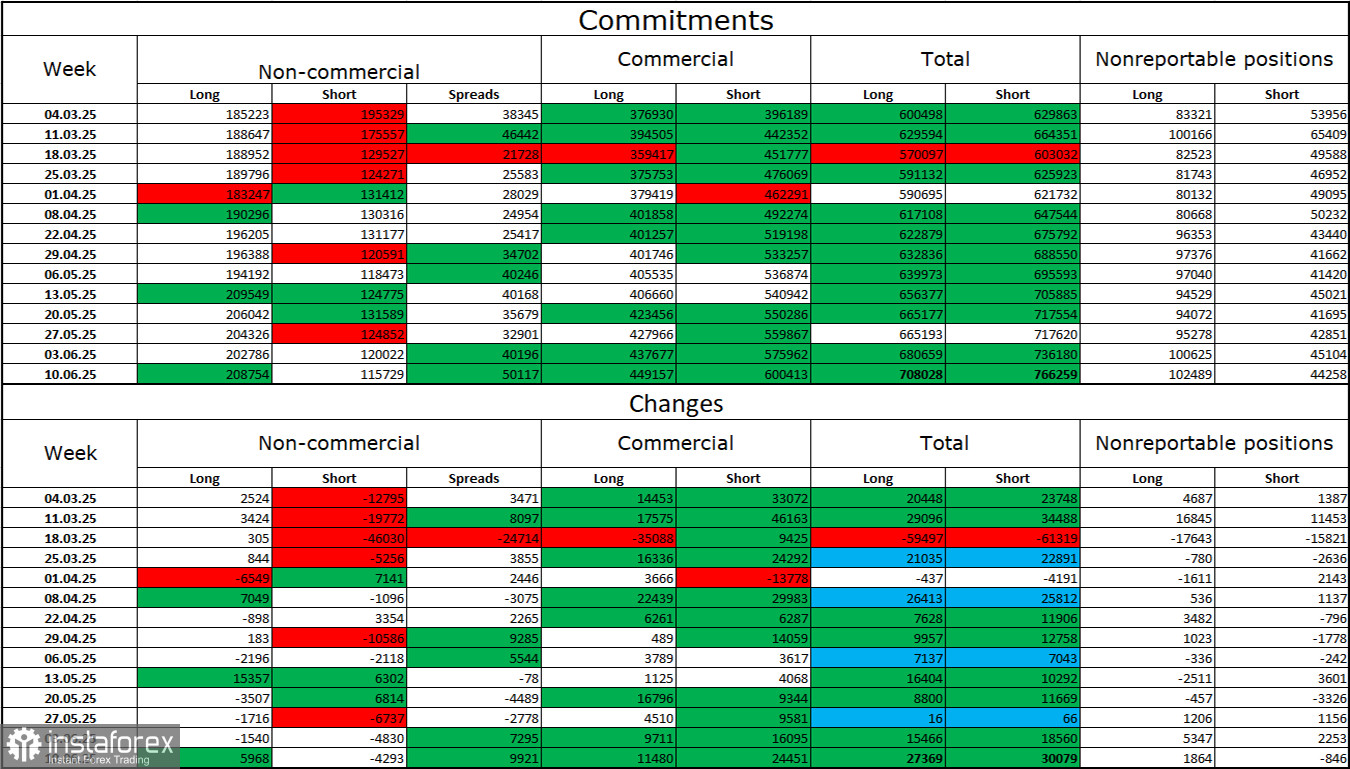
During the last reporting week, professional traders opened 5,968 Long positions and closed 4,293 Short positions. The sentiment among the "Non-commercial" group remains "bullish," largely thanks to Donald Trump. The total number of Long positions held by speculators now stands at 208,000, compared to 115,000 Short positions. The gap (with few exceptions) continues to widen. Thus, demand remains strong for the euro, but not for the dollar. The situation remains unchanged.
For nineteen consecutive weeks, large players have been reducing their Short positions and increasing their Long ones. The difference in monetary policy between the ECB and the Fed is already quite significant, but Trump's political decisions remain the more influential factor for traders, as they may trigger a recession in the U.S. and cause numerous long-term structural problems for the American economy.
News Calendar for the U.S. and the Eurozone
The June 16 economic calendar contains no noteworthy entries. Therefore, the influence of the news background on market sentiment will be negligible on Monday.
EUR/USD Forecast and Trading Tips
Selling opportunities were available after the pair closed below the 1.1574 level on the hourly chart with a target of 1.1454. These positions can still be held open. I would recommend considering buying opportunities either on a rebound from the 1.1454 level or after a close above 1.1574.
Fibonacci retracement levels are drawn from 1.1574–1.1066 on the hourly chart and from 1.1214–1.0179 on the 4-hour chart.

