यह भी देखें

 17.06.2025 08:57 PM
In my morning forecast, I highlighted the 1.3559 level and planned to make trading decisions based on it. Let's look at the 5-minute chart and see what happened. A decline and the formation of a false breakout at that level led to a buying opportunity for the pound, but the move upward didn't materialize into anything significant. The technical outlook has been revised for the second half of the day.
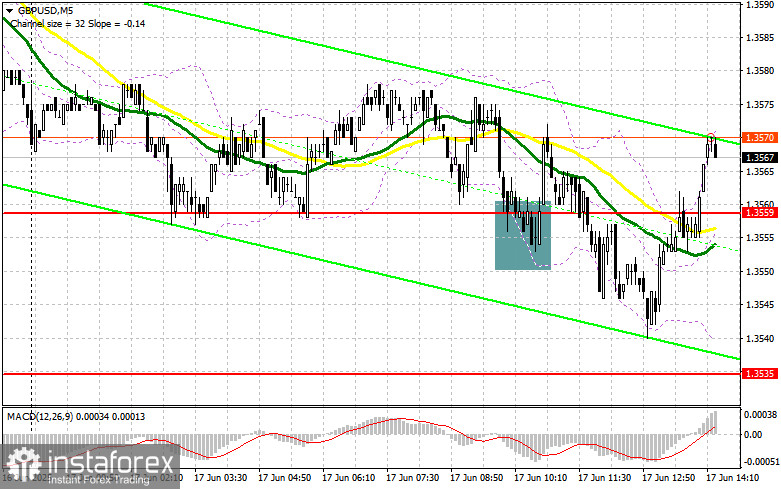
To Open Long Positions on GBP/USD:
It's clear that only very strong data on retail sales and industrial production will support the dollar and restore pressure on the pair—which I plan to take advantage of. In the event of a GBP/USD decline, I prefer to act around the new support at 1.3535, formed yesterday. A false breakout there will give a good entry point for long positions with the target of returning to resistance at 1.3578. A breakout and retest from top to bottom of this range will offer a new long entry point with the potential to update 1.3603. The ultimate target will be the 1.3630 level, where I plan to take profit.
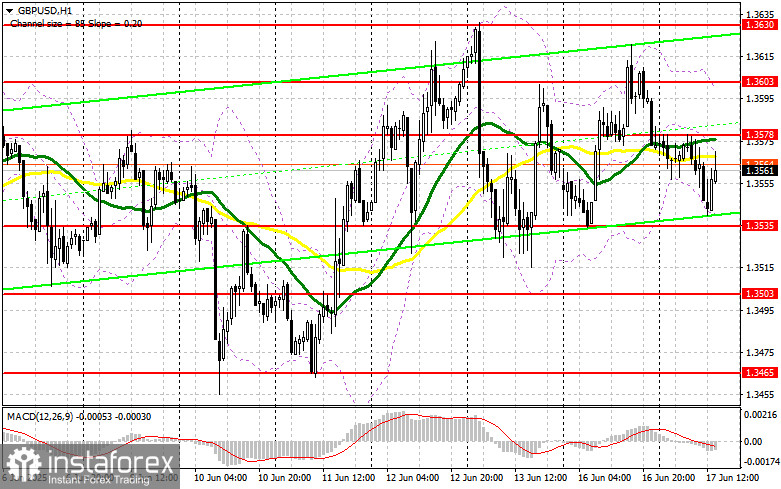
If GBP/USD declines and bulls show no activity around 1.3535 in the second half of the day, pressure on the pound may increase, pushing the pair toward the lower boundary of the sideways channel. In this case, only a false breakout near 1.3503 will offer a valid signal to open long positions. I plan to buy GBP/USD on a rebound from 1.3465 with a target of 30–35 points intraday correction.
To Open Short Positions on GBP/USD:
Sellers tried but failed to spark a larger sell-off or keep the market under control. In the second half of the day, the focus will shift to the 1.3578 level, where the moving averages are located—currently favoring the bears. A false breakout at that level will provide an entry point for short positions aiming for a drop toward support at 1.3535. A breakout and retest from the bottom up of this range will likely trigger stop-losses and open the path to 1.3503. The ultimate target will be 1.3465, where I plan to take profit.
If demand for the pound returns in the second half of the day and bears don't show strength at 1.3578, a larger upward move in GBP/USD is possible. In this case, it's better to delay short positions until a test of resistance at 1.3603. I will only open shorts there if a false breakout forms. If there's no downward movement at that level either, I'll look for shorts on a rebound from 1.3630, aiming for a 30–35 point intraday correction.
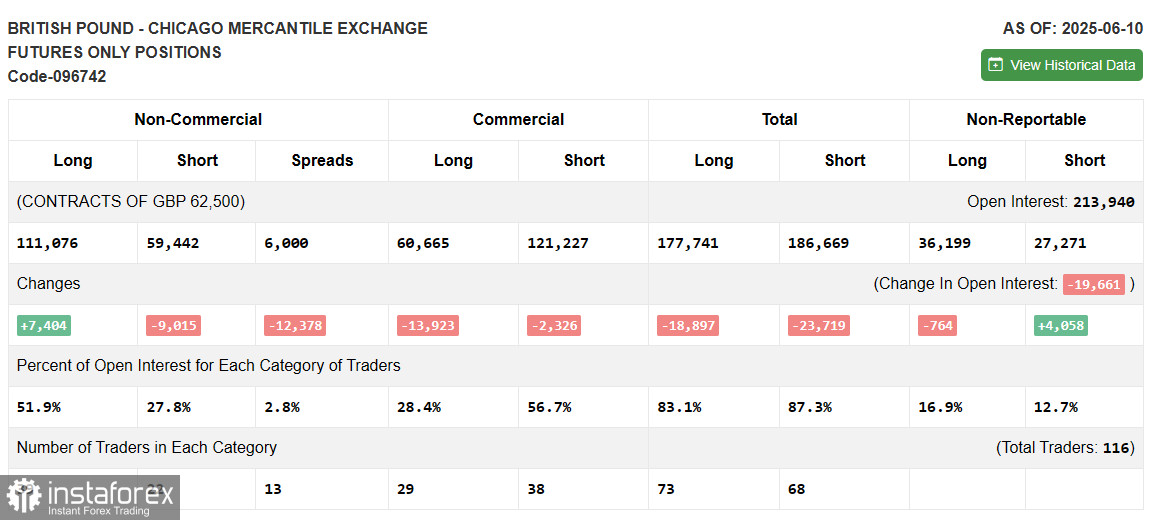
Commitments of Traders (COT) Report (June 10):
The latest COT report showed an increase in long positions and a reduction in shorts. Despite clear signals that the Federal Reserve will keep interest rates steady, the sharp drop in U.S. inflation data failed to meaningfully support the dollar, which boosted demand for the British pound.
The decisive factor for the dollar's next move will be Jerome Powell's interpretation of the inflation situation and his projections on possible rate cuts this fall. The future direction of GBP/USD will depend on those statements, as the pair continues to show steady growth.
According to the latest COT report, long non-commercial positions increased by 7,404 to 111,076. Short non-commercial positions fell by 9,015 to 59,442. As a result, the gap between longs and shorts widened by 12,378 in favor of the bulls.
Indicator Signals:
Moving AveragesTrading is taking place below the 30- and 50-period moving averages, indicating potential pound weakness.
Note: The moving average periods and prices are based on the author's hourly (H1) chart and differ from classical daily moving averages on a D1 chart.
Bollinger Bands If the pair declines, the lower boundary of the indicator around 1.3545 will act as support.
Indicator Descriptions:

