यह भी देखें

 01.07.2025 05:15 AM
USD/JPY
On the daily chart, the price has consolidated below the balance indicator line (red moving average), and the Marlin oscillator is confidently declining within the territory of a downtrend.
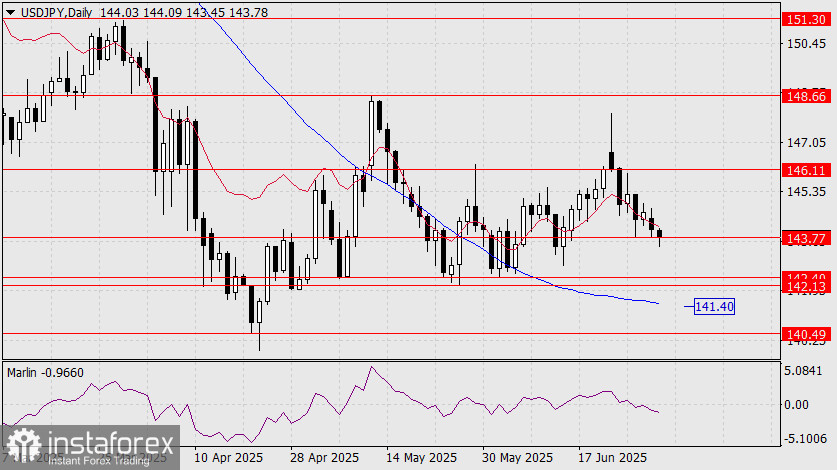
The target for the movement is the 142.13–142.40 range, formed by the support levels from May 6 and May 27. Next, we expect a test of the MACD line at 141.40 — a successful breakthrough would confirm the establishment of a medium-term downward trend.
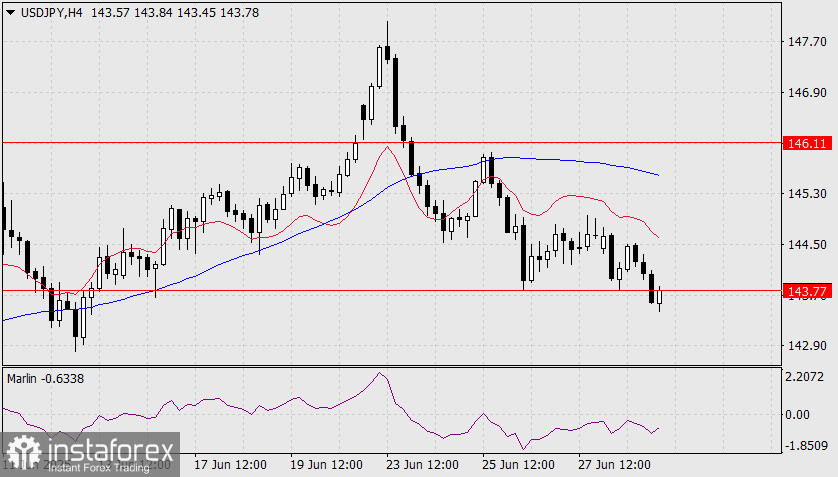
On the H4 chart, the price has settled below the 143.77 level. Both indicator lines have turned downward, and the Marlin oscillator has remained in the negative trend zone. We expect the price to reach the aforementioned target range of 142.13–142.40.
You have already liked this post today
*यहां पर लिखा गया बाजार विश्लेषण आपकी जागरूकता बढ़ाने के लिए किया है, लेकिन व्यापार करने के लिए निर्देश देने के लिए नहीं |

