यह भी देखें

 01.07.2025 07:01 AM
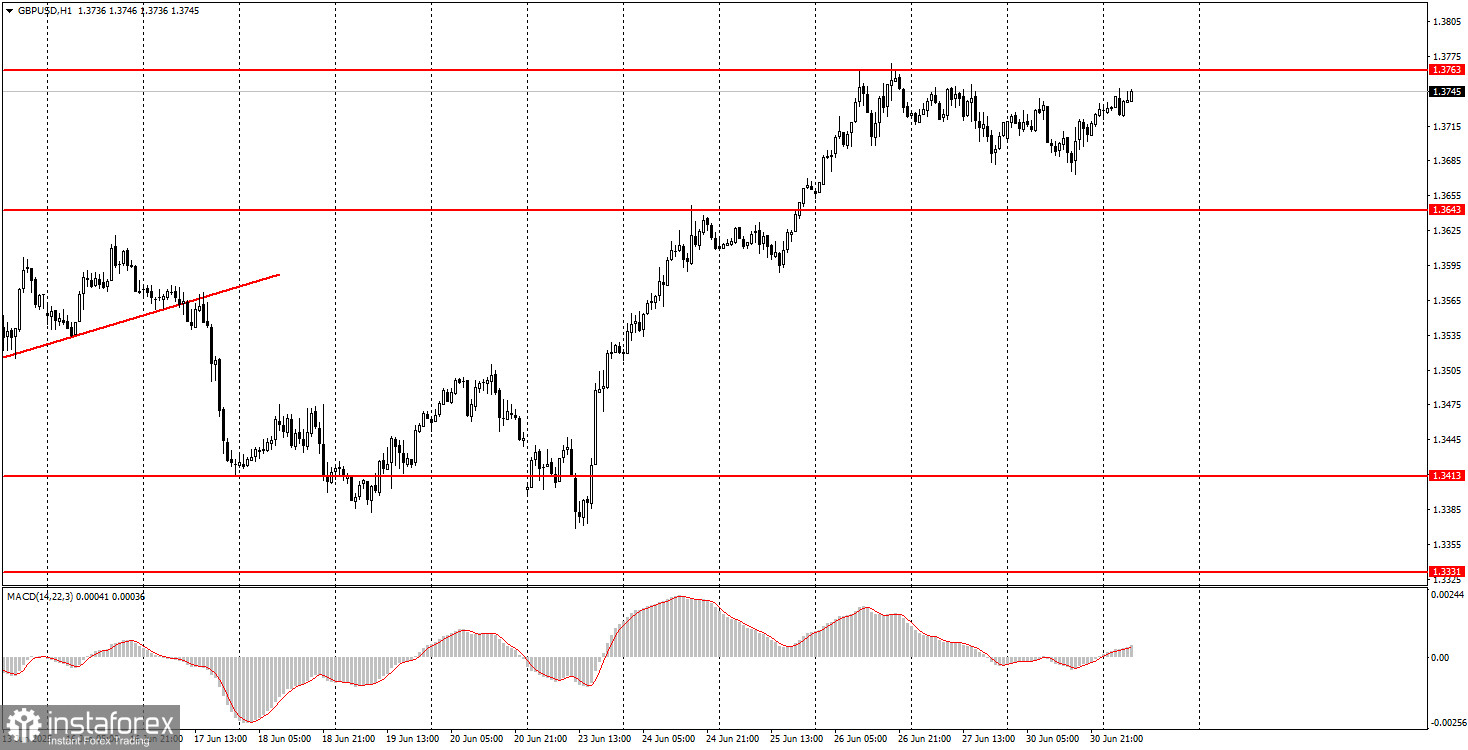
The GBP/USD pair also attempted to resume its upward movement on Monday, although it was less successful than the EUR/USD pair. Still, the British pound has no real problems continuing its rise. If it didn't appreciate yesterday, it will likely do so today. The U.S. dollar continues to decline across the board, so it's only a matter of time and momentum. Sometimes, the euro rallies stronger and faster, and other times, the British pound takes the lead.
Yesterday, the UK released a relatively positive GDP report for the first quarter, despite the third estimate not differing from the second. Nevertheless, the British economy showed its second-best growth rate in the last three years. It's unlikely that this factor alone triggered the next upward wave, but it adds to the list of reasons encouraging traders to keep buying. The British economy is now growing faster than the American one—or rather, "it's growing, unlike the American one."
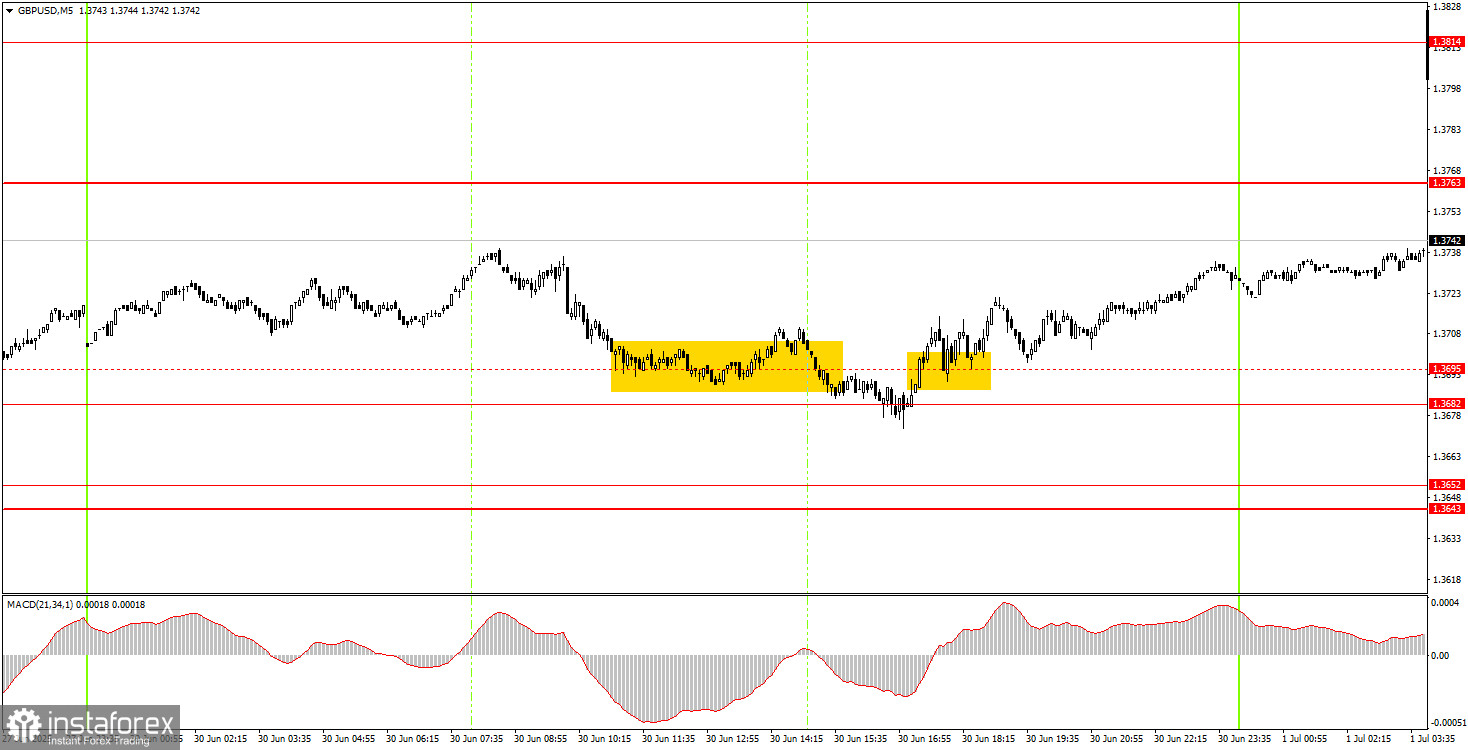
On the 5-minute timeframe, two trading signals were generated on Monday, and by the end of the day, the level at 1.3695 was revised to 1.3682. The first sell signal turned out to be false, but the second buy signal allowed traders to offset the loss from the first trade and even gain a small profit. A reminder for novice traders: a one-directional, nearly pullback-free move isn't always a good thing, as it may lead to ignored levels. The market continues to buy and buy.
On the hourly timeframe, the GBP/USD pair remains focused on Donald Trump and continues to be highly skeptical of his policies. The market is still either selling the dollar or waiting for new negative news from across the Atlantic to justify further selling. This situation will likely persist until the market sees clear signs of the end of the trade war—and until Donald Trump stops making decisions, he has no authority to make decisions that leave market participants in shock.
On Tuesday, the GBP/USD pair may continue its upward movement as the market has entered a new phase of the bullish trend. As before, there are plenty of fundamental reasons for the market to flee from the U.S. dollar.
On the 5-minute timeframe, the following levels can be used for trading: 1.3203–1.3211, 1.3259, 1.3329–1.3331, 1.3413–1.3421, 1.3518–1.3535, 1.3580–1.3592, 1.3643–1.3652, 1.3695, 1.3763, 1.3814–1.3832.
On Tuesday, the UK will release the Manufacturing PMI for June, and Bank of England Governor Andrew Bailey is scheduled to speak. In the U.S., the focus will be on the ISM Manufacturing PMI, along with a speech by Federal Reserve Chair Jerome Powell.
Support and Resistance Levels: These are target levels for opening or closing positions and can also serve as points for placing Take Profit orders.
Red Lines: Channels or trendlines indicating the current trend and the preferred direction for trading.
MACD Indicator (14,22,3): A histogram and signal line used as a supplementary source of trading signals.
Important Events and Reports: Found in the economic calendar, these can heavily influence price movements. Exercise caution or exit the market during their release to avoid sharp reversals.

