यह भी देखें

 04.07.2025 05:53 AM
Natural Gas (NG)
The daily balance indicator line decisively halted yesterday's price surge — Thursday ended with a decline of 2.63%. The drop, in turn, was held back by the MACD line.
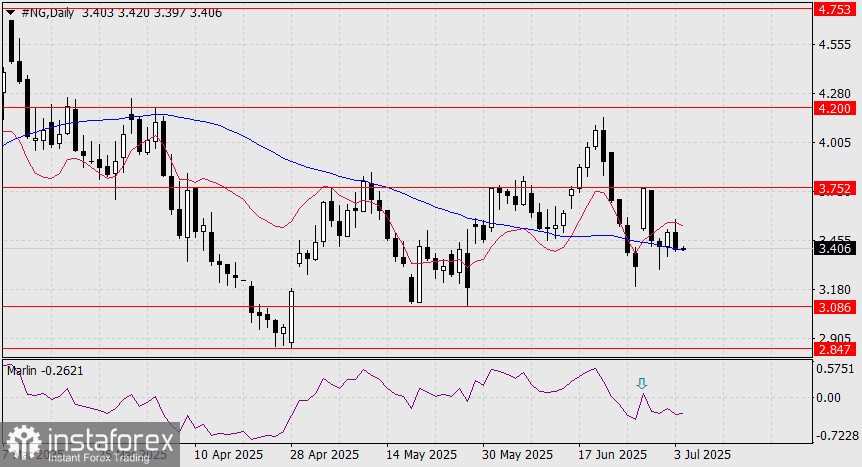
A daily close below yesterday's low of 3.392 will indicate a break below the MACD line support, opening the way to the target of 3.086. Beyond that, we expect a further decline toward the target level of 2.847, provided the Marlin oscillator does not enter the oversold zone by then.
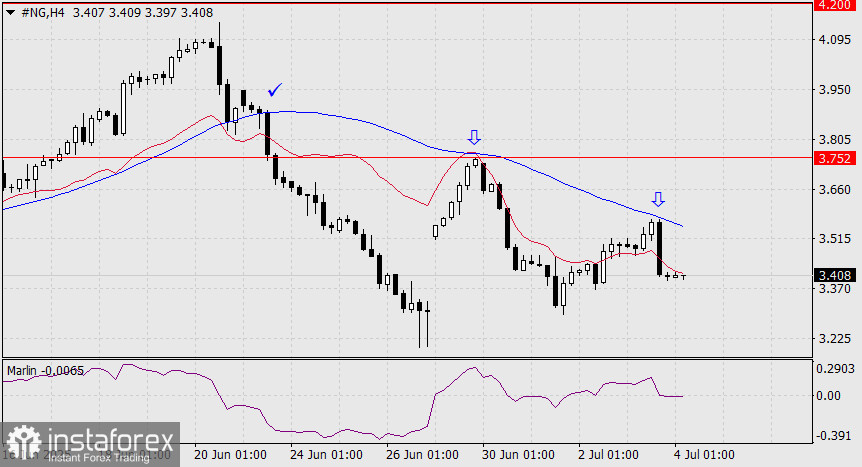
On the H4 chart, after falling below the MACD line on June 23 (check mark), the price has twice attempted to return to that indicator line but failed to reach it both times (check marks). Currently, the price is developing below the balance line, and the Marlin oscillator is moving horizontally exactly along the zero line. These are signs of preparation for a further decline.
You have already liked this post today
*यहां पर लिखा गया बाजार विश्लेषण आपकी जागरूकता बढ़ाने के लिए किया है, लेकिन व्यापार करने के लिए निर्देश देने के लिए नहीं |

