यह भी देखें

 09.07.2025 10:03 AM
Trade Review and Strategy for the Japanese Yen
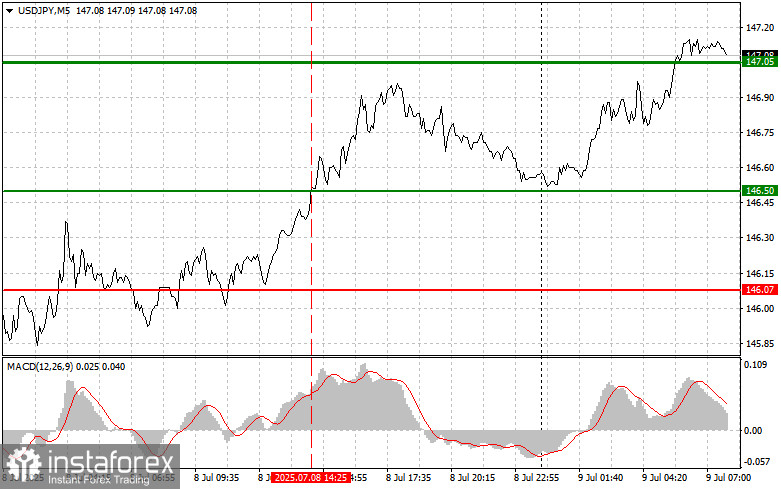
The test of the 146.50 level occurred when the MACD indicator had already moved significantly above the zero line, limiting the dollar's upward potential. For this reason, I did not buy the dollar.
Following the reintroduction of strict tariff measures by Donald Trump, the U.S. dollar began to strengthen. The U.S. president's announcement of a 50% tariff on copper imports and plans for tariffs of up to 200% on imported pharmaceuticals had an immediate impact on global markets. Investors are concerned that such measures could trigger a more severe trade conflict with negative consequences for the global economy. Given the lack of a trade deal with Japan, it is no surprise that the yen has been losing ground against the U.S. dollar in recent weeks.
Today's positive data on Japan's money supply growth failed to support the yen. Investors seem more focused on global economic uncertainty linked to tariffs, which has fueled demand for safer assets such as the U.S. dollar. Despite positive domestic indicators, the yen remains vulnerable to external factors. Weak global demand and ongoing trade disputes continue to pressure Japan's export-driven economy. Meanwhile, the Bank of Japan maintains a wait-and-see monetary policy stance, despite earlier expectations of a more aggressive rate-hike path. This also limits the yen's growth potential.
As for today's intraday strategy, I will primarily focus on executing Buy and Sell Scenarios #1 and #2.
Buy Scenarios
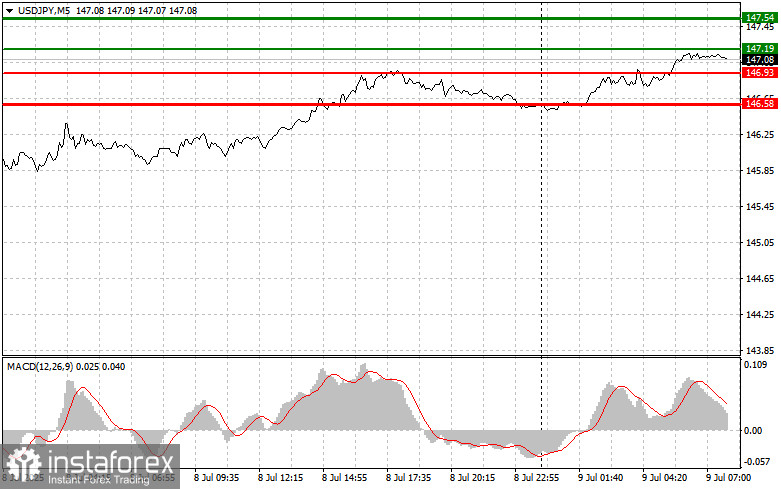
Scenario #1: I plan to buy USD/JPY today if the price reaches the 147.19 level (green line on the chart), targeting a rise to 147.54 (thicker green line). Around 147.54, I will exit long positions and open short positions in the opposite direction (aiming for a 30–35 point retracement). Buying the pair is best done on corrections and deeper pullbacks.Important: Before buying, make sure the MACD indicator is above the zero line and just beginning to rise.
Scenario #2: I also plan to buy USD/JPY if the price tests 146.93 twice in a row while the MACD is in the oversold zone. This will likely limit the pair's downward potential and prompt a reversal to the upside. Target levels in this case are 147.19 and 147.54.
Sell Scenarios
Scenario #1: I plan to sell USD/JPY only after the price breaks below 146.93 (red line on the chart), which should lead to a quick decline. The main target for sellers will be 146.58, where I plan to exit short positions and open long positions in the opposite direction (expecting a 20–25 point move back from the level). Strong downward pressure on the pair is unlikely today.Important: Before selling, make sure the MACD is below the zero line and just beginning to decline.
Scenario #2: I also plan to sell USD/JPY if the price tests 147.19 twice in a row while the MACD is in the overbought zone. This will limit the pair's upward potential and prompt a reversal to the downside. In this case, expect a drop to 146.93 and 146.58.
What's on the chart:
Important:Beginner traders on the Forex market should exercise great caution when deciding to enter trades. It is best to stay out of the market before the release of important fundamental reports to avoid sudden price swings. If you choose to trade during news events, always use stop-loss orders to minimize potential losses. Without stop-losses, you risk quickly losing your entire deposit, especially if you trade with large volumes and no money management strategy.
And remember: successful trading requires a clear plan, such as the one presented above. Making spontaneous trading decisions based on current market conditions is a losing strategy for intraday traders.

