यह भी देखें

 11.07.2025 07:09 AM
EUR/USD On the weekly chart, we observe a set of reversal signals: divergence, a trend shift in the Fibonacci time zone, and a price rebound from the intersection of two strong lines — the price channel boundary and a Fibonacci ray.
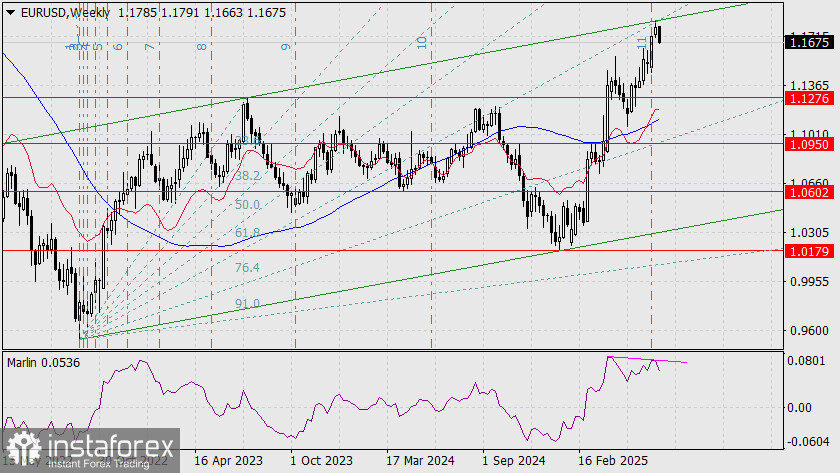
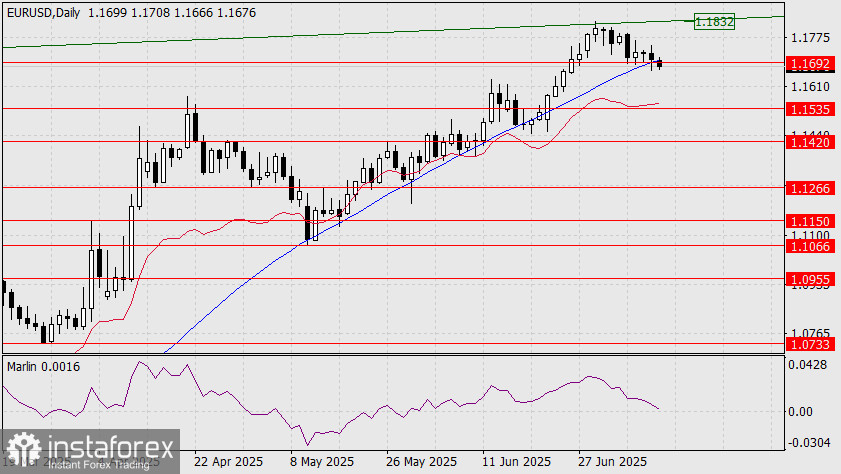
If the week closes even at current levels, a long-term downward path (toward 0.9260) opens up for the euro. On the daily chart, today's session opened below the Kijun-sen (MACD) line. If Friday ends with a black candlestick, it will confirm a break below both this line and the 1.1692 level, opening the way to the next target support at 1.1535.
The Marlin oscillator has already abandoned attempts to form a divergence that would allow the price to revisit the upper boundary of the price channel (1.1832). On the H4 chart, the price has consolidated below the 1.1692 level, and Marlin has also settled in bearish territory.
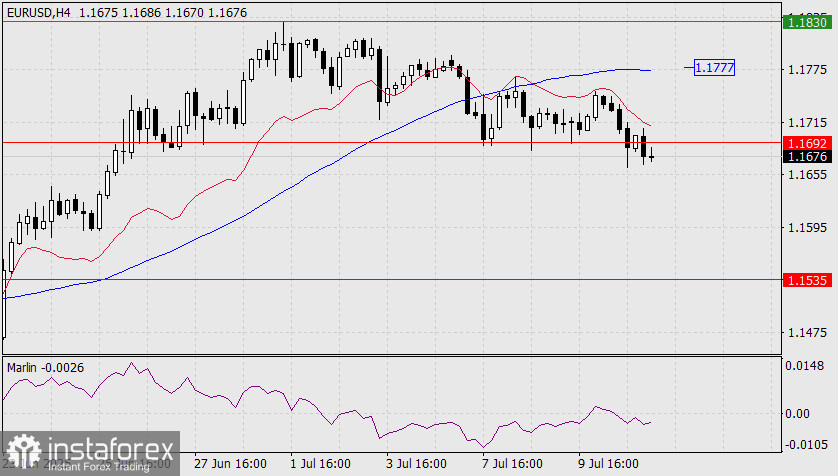
It is possible that the price may still attempt to retest resistance at the Kijun-sen line (1.1777), which on the daily chart would appear as a reversal effort aimed at reaching 1.1832. For this reason, key developments are expected starting next week.
You have already liked this post today
*यहां पर लिखा गया बाजार विश्लेषण आपकी जागरूकता बढ़ाने के लिए किया है, लेकिन व्यापार करने के लिए निर्देश देने के लिए नहीं |

