यह भी देखें

 14.07.2025 05:31 AM
On the daily chart, the AUD/USD pair is positioned between the MACD line (0.6551) and the upper boundary of the local price channel (blue, 0.6597). A breakout of either level will indicate the price's intention to continue in the chosen direction.
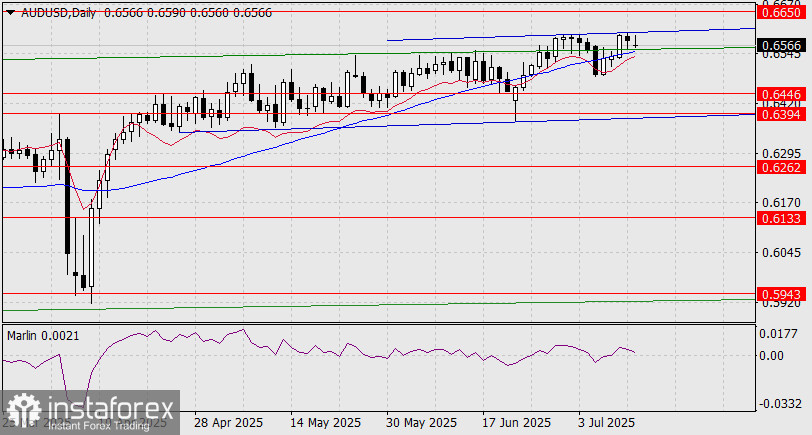
However, to the upside, the target level of 0.6650 is relatively close, which makes the bulls somewhat hesitant. The downside target is more substantial — 0.6446, possibly even 0.6394.
The Marlin oscillator remains in positive territory for now, but is approaching the border with the downtrend zone. There is a sense of tense anticipation. Bears have a slight advantage of 55%, making the reversal scenario the primary one.
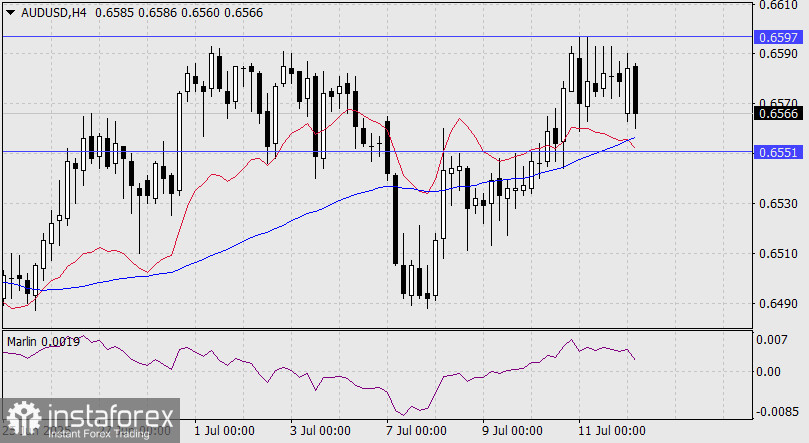
On the H4 chart, the Marlin oscillator has formed a pattern indicating readiness to move into negative territory. A price consolidation below the 0.6551 level (the MACD line on the daily chart) will also represent consolidation below the MACD line on the H4 chart. The alignment of indicator lines across timeframes gives this level additional strength. If 0.6551 is breached, a sharp downward movement in price is likely.
You have already liked this post today
*यहां पर लिखा गया बाजार विश्लेषण आपकी जागरूकता बढ़ाने के लिए किया है, लेकिन व्यापार करने के लिए निर्देश देने के लिए नहीं |

