यह भी देखें

 16.07.2025 06:11 AM
Last week, a false breakout occurred on the weekly scale above the MACD line. This week, the price is forcefully returning below the line.
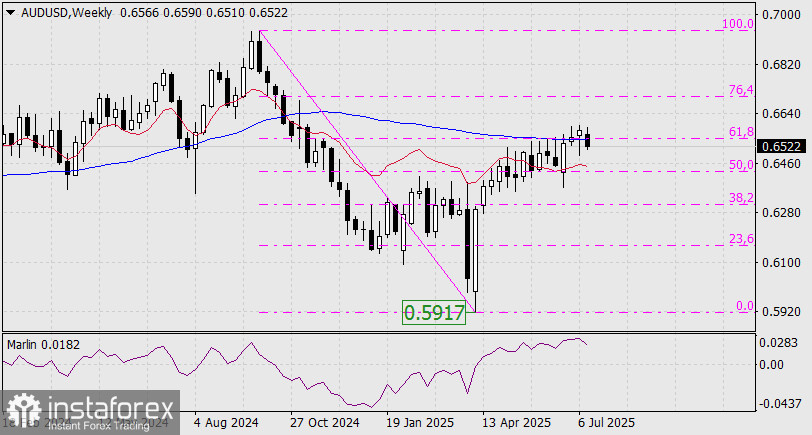
The Marlin oscillator has turned downward. It is possible that the entire rise since early April was merely a deep 61.8% correction of the downward move from September 2024. This suggests that the price may fall below the April low of 0.5917.
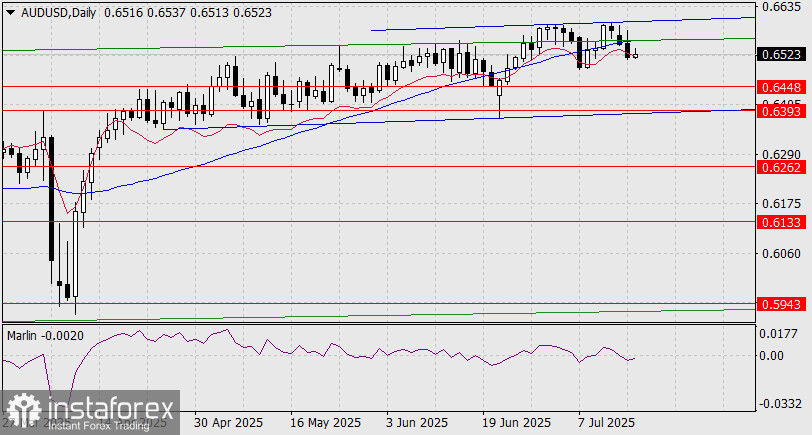
On the daily chart, the price has settled below the internal line of the green price channel and the MACD line. The price will likely attempt to reach the lower boundary of the local blue price channel near the target level of 0.6393. A correction from the first target of 0.6448 (on this chart) is possible.
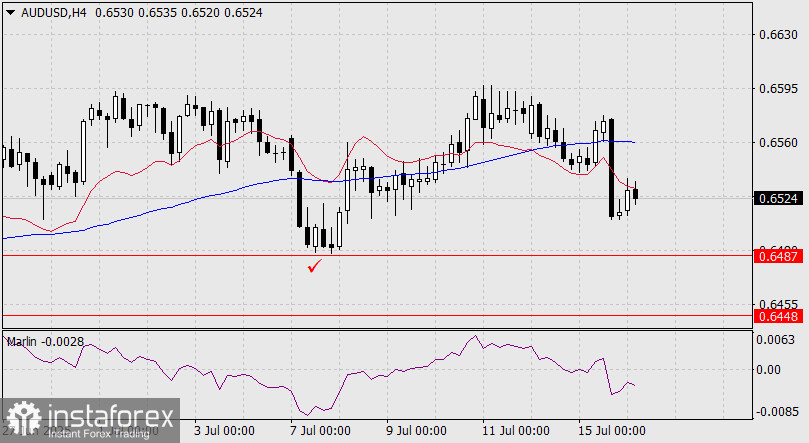
On the four-hour scale, the price is reversing from the resistance of the balance line. The MACD line appears to be turning downward, signaling the direction of the short-term trend. The first target is 0.6487, which corresponds to the low from July 7. A consolidation below this level opens the path to 0.6448.
You have already liked this post today
*यहां पर लिखा गया बाजार विश्लेषण आपकी जागरूकता बढ़ाने के लिए किया है, लेकिन व्यापार करने के लिए निर्देश देने के लिए नहीं |

