यह भी देखें

 17.07.2025 12:12 PM
Trend Analysis (Figure 1)
On Thursday, the market may continue its downward move from the 1.3417 level (yesterday's daily close), targeting 1.3369 – the lower fractal (yellow dashed line). From this level, the price may rebound upward toward 1.3405 – the historical resistance level (light blue dashed line).
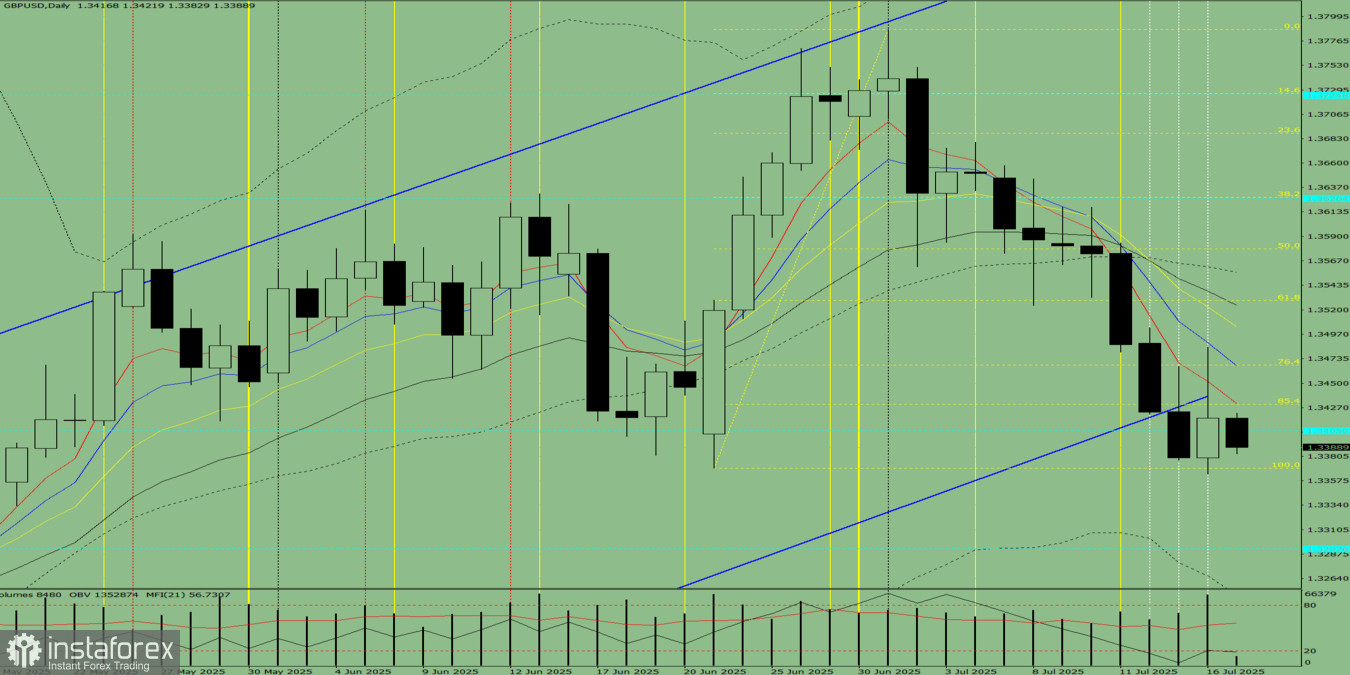
Figure 1 (daily chart)
Comprehensive Analysis:
Overall conclusion: a bearish trend.
Alternative scenario: From the 1.3417 level (yesterday's daily close), the price may continue downward toward 1.3369 – the lower fractal (yellow dashed line). From this level, it may then continue further down toward 1.3293 – the historical resistance level (light blue dashed line).
You have already liked this post today
*यहां पर लिखा गया बाजार विश्लेषण आपकी जागरूकता बढ़ाने के लिए किया है, लेकिन व्यापार करने के लिए निर्देश देने के लिए नहीं |

