यह भी देखें

 18.07.2025 01:14 PM
Trend Analysis (Fig. 1):
On Friday, the market may continue moving upward from the 1.3412 level (yesterday's daily close), targeting 1.3464 – the 23.6% retracement level (red dashed line). Upon testing this level, a downward movement may follow with a target of 1.3430 – the 85.4% retracement level (yellow dashed line).
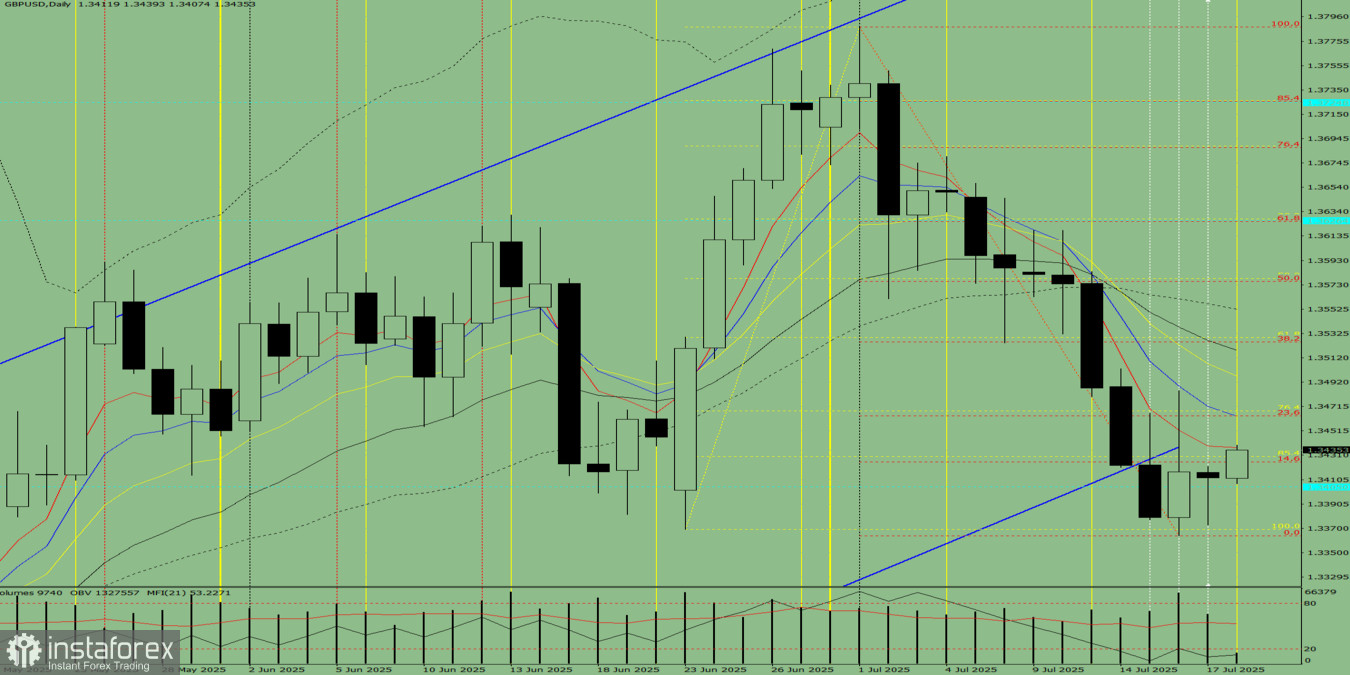
Fig. 1 (Daily Chart)
Comprehensive Analysis:
Overall conclusion: bullish trend.
Alternative scenario:The price may start moving upward from the 1.3412 level (yesterday's daily close), targeting 1.3463 – the 8-period EMA (thin red line). Upon testing this line, a downward movement toward 1.3405 – historical support level (blue dashed line), is possible.
You have already liked this post today
*यहां पर लिखा गया बाजार विश्लेषण आपकी जागरूकता बढ़ाने के लिए किया है, लेकिन व्यापार करने के लिए निर्देश देने के लिए नहीं |

