यह भी देखें

 22.07.2025 06:35 AM
Let's examine the weekly chart of the AUD/USD pair. The week of July 7–11 saw the price consolidate above the MACD line and the inner line of the green price channel. However, in the following week, there was a sharp downward move, and the price nearly reached the balance indicator line.
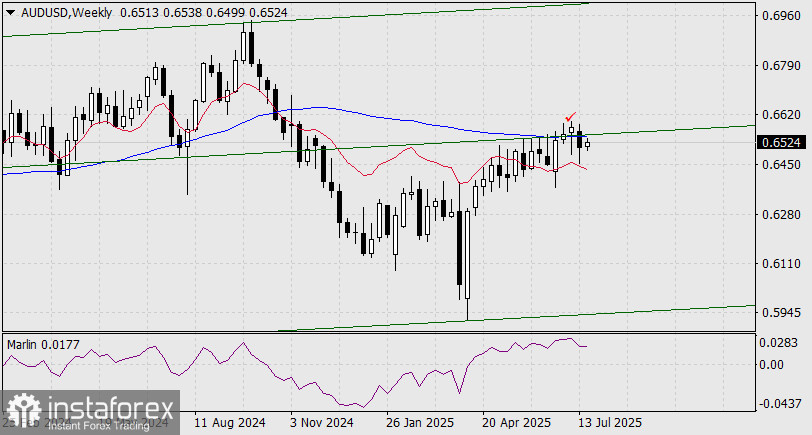
The current weekly candlestick appears to be setting up for a continuation of the decline, as confirmed by the Marlin oscillator. This suggests that the breakout above the resistance lines two weeks ago was false — a sign pointing to further downward movement in the medium term.
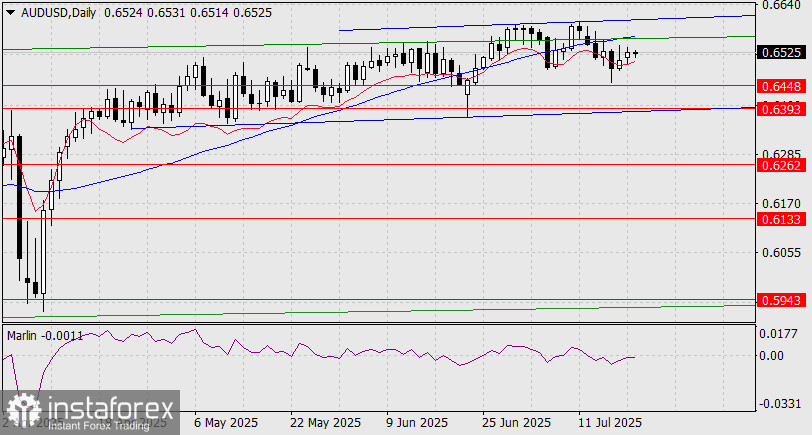
On the daily chart, the price remains above the balance line; however, the Marlin oscillator, which is turning downward from the zero (neutral) line, indicates a potential second attempt to break through the support level at 0.6448. The first such attempt occurred on July 17.
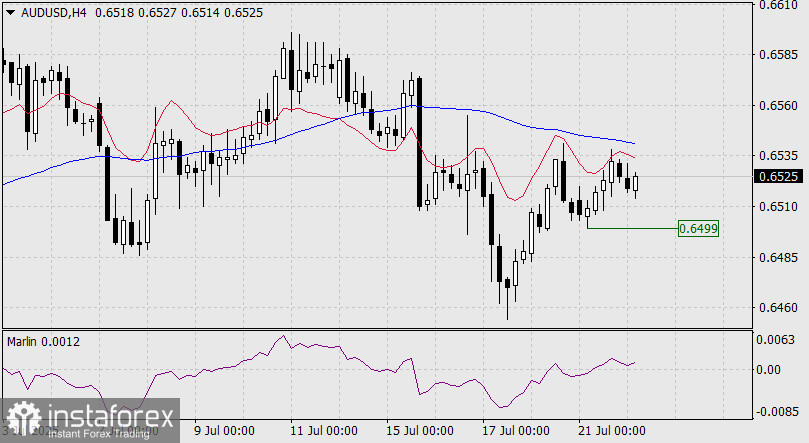
On the four-hour chart, the price is moving below the balance and MACD indicator lines, though the Marlin oscillator remains firmly positioned in positive territory. In the short term, the pair remains in a sideways trend. A firm close below the July 21 low would fully prepare the price for a move toward 0.6448.
You have already liked this post today
*यहां पर लिखा गया बाजार विश्लेषण आपकी जागरूकता बढ़ाने के लिए किया है, लेकिन व्यापार करने के लिए निर्देश देने के लिए नहीं |

