यह भी देखें

 28.07.2025 07:12 PM
This week, the market may start moving downward from the 1.1742 level (the close of the last weekly candle) with a target at 1.1536 – the 38.2% retracement level (blue dashed line). Upon testing this level, the price may begin an upward movement targeting 1.1571 – the upper fractal (red dashed line).
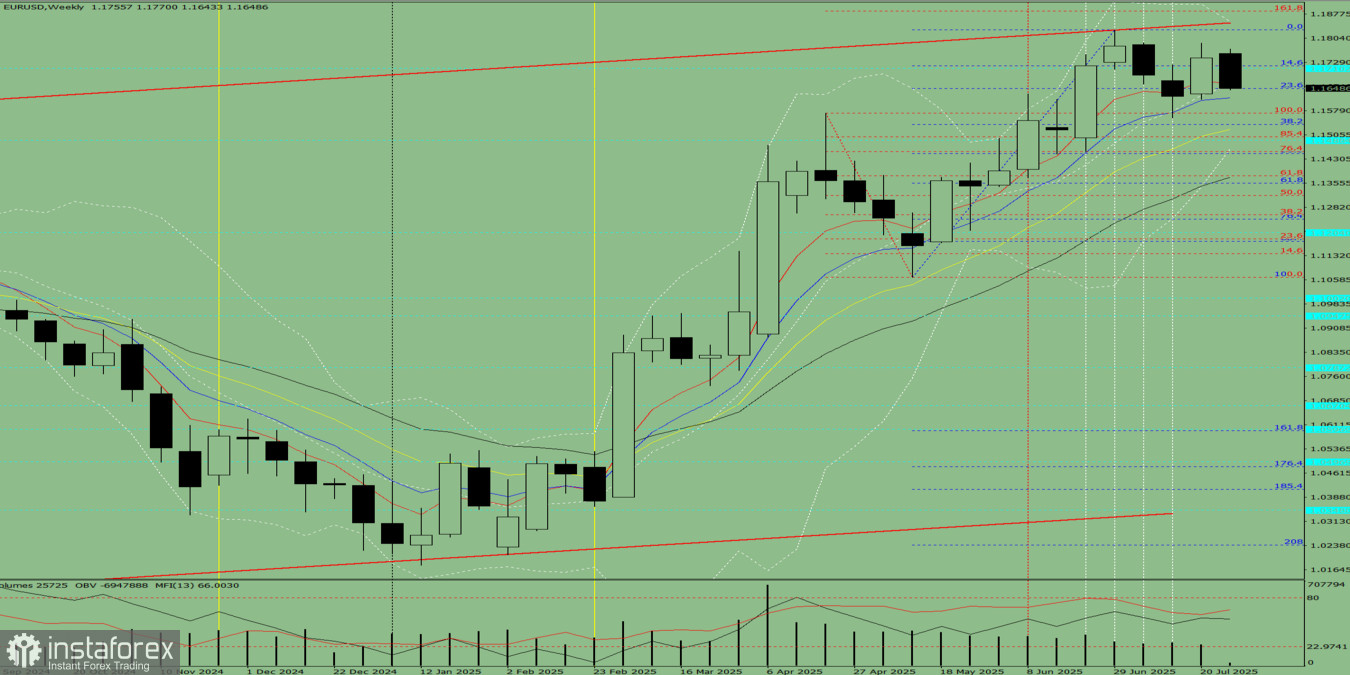
Figure 1 (Weekly Chart)
Conclusion from the Comprehensive Analysis: downward movement.
The price is most likely to show a downward trend throughout the week, with the weekly black candle lacking an upper shadow (Monday – down), and forming a lower shadow (Friday – up).
The pair may begin moving downward from the 1.1742 level (close of the last weekly candle) toward the target of 1.1498 – the 85.4% retracement level (red dashed line). Upon testing this level, the price may start an upward movement targeting 1.1571 – the upper fractal (red dashed line).
You have already liked this post today
*यहां पर लिखा गया बाजार विश्लेषण आपकी जागरूकता बढ़ाने के लिए किया है, लेकिन व्यापार करने के लिए निर्देश देने के लिए नहीं |

