यह भी देखें

 11.08.2025 09:55 AM
Trend Analysis (Fig. 1).
This week, from the 1.1641 level (close to the last weekly candle), the market may start moving downward toward 1.1448 – the 50% retracement level (blue dotted line). Upon testing this level, the price may start moving upward toward 1.1488 – a historical resistance level (blue dotted line).
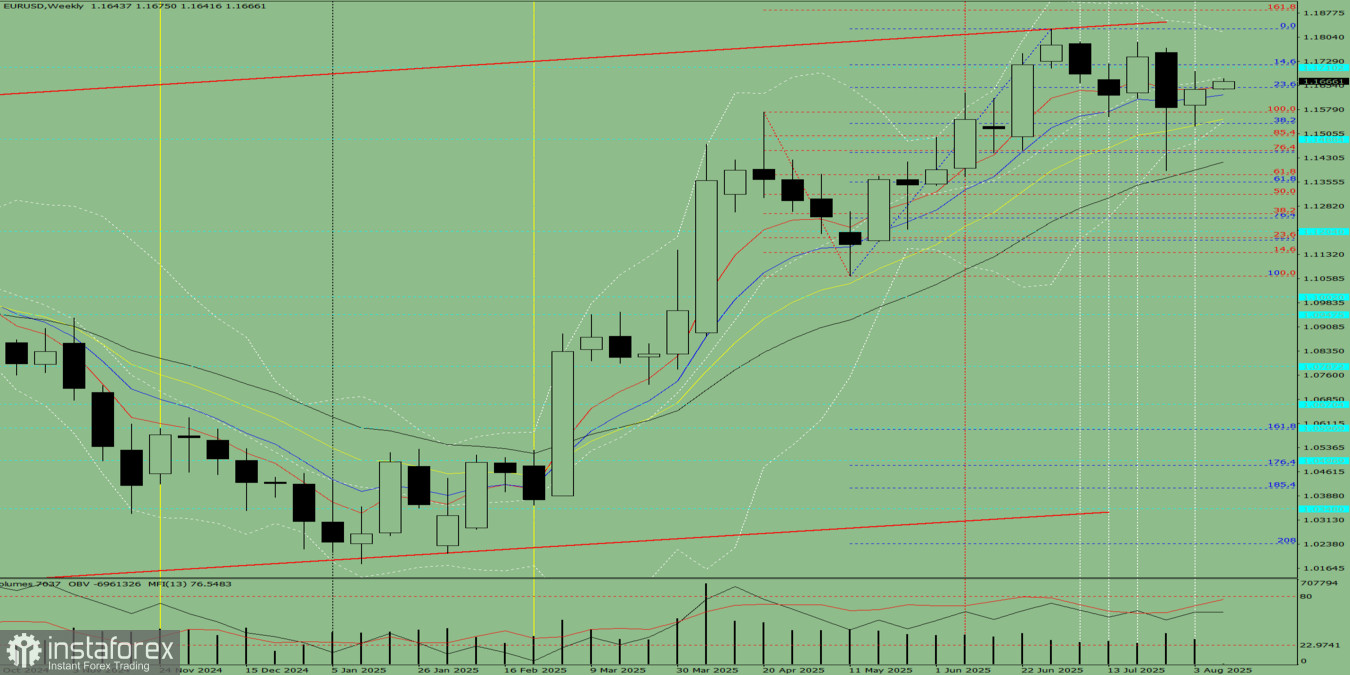
Fig. 1 (Weekly Chart).
Comprehensive Analysis:
Conclusion from comprehensive analysis: downward movement.
Overall forecast for the weekly EUR/USD candle: the price will most likely maintain a bearish trend during the week, with the first upper shadow on the weekly black candle (Monday – upward movement) and a second lower shadow (Friday – upward movement).
Alternative scenario: from the 1.1641 level (close of the last weekly candle), the pair may continue moving upward toward 1.1710 – the historical resistance level (blue dotted line). Upon testing this level, the price may start moving downward toward 1.1447 – the 50% retracement level (blue dotted line).
You have already liked this post today
*यहां पर लिखा गया बाजार विश्लेषण आपकी जागरूकता बढ़ाने के लिए किया है, लेकिन व्यापार करने के लिए निर्देश देने के लिए नहीं |

