यह भी देखें

 13.08.2025 11:48 AM
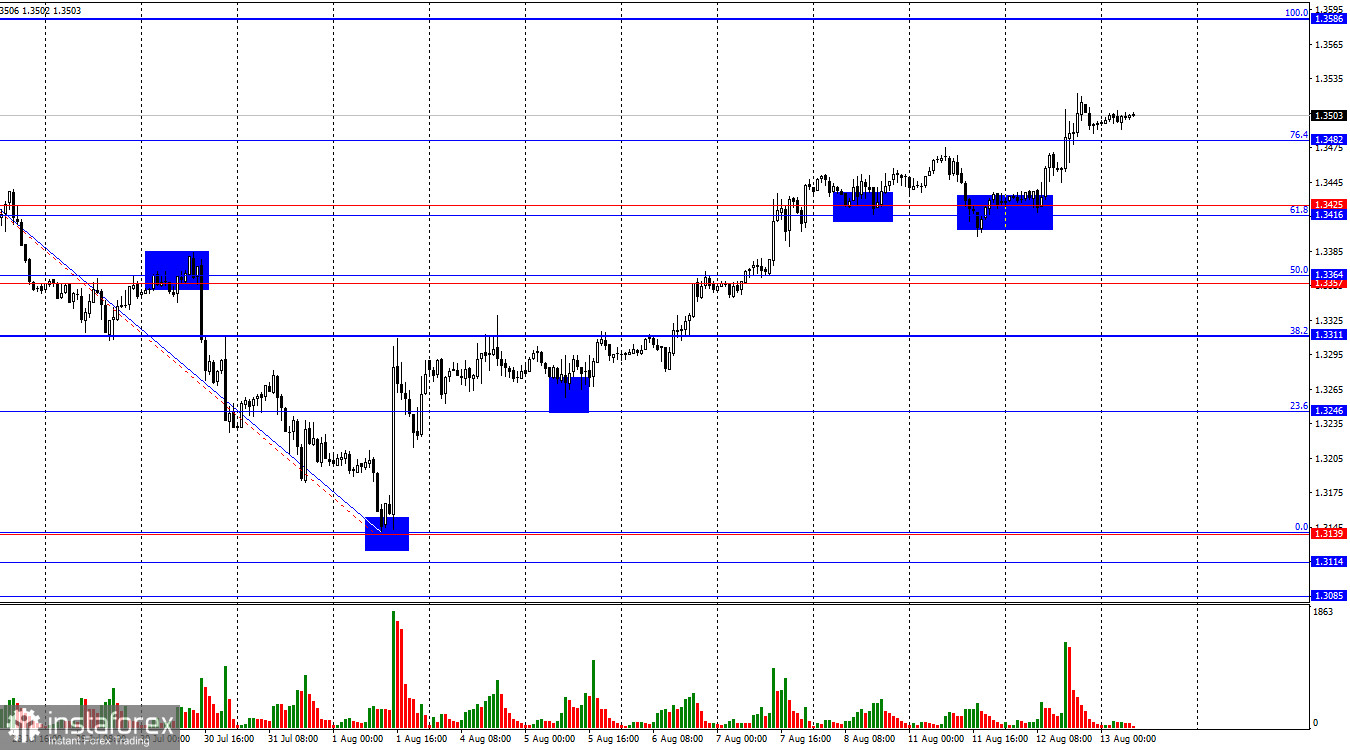
On the hourly chart, the GBP/USD pair on Tuesday once again rebounded from the support zone of 1.3416–1.3425 and turned in favor of the pound, subsequently consolidating above the 76.4% Fibonacci level at 1.3482. Thus, the upward movement may continue today toward the next 100.0% retracement level at 1.3586. A close below 1.3482 would favor the U.S. dollar and a return to the 1.3416–1.3425 support zone.
The wave structure remains bearish. The last completed upward wave broke the highs of the two previous waves, but the last downward wave also broke all previous lows. Therefore, the trend can be considered bearish, although the news background has played a major role in shaping it. In my view, the news background has already turned the pair toward the bulls, so the trend may soon become bullish again. The situation is mixed and largely dependent on news developments.
The news background on Tuesday was very favorable for bullish traders. In the morning, U.K. statistics did not disappoint, and in the second half of the day, U.S. inflation came in below forecasts. While this is not entirely accurate (core inflation rose more than traders expected), the market interpreted the data as weak inflation, immediately raising the probability of FOMC monetary policy easing in September to nearly 100%. As a result, the dollar not only posted another decline on Tuesday but also retains prospects for further depreciation, as the news background is providing no support.
If Friday's talks between Russia and the United States are positive, bullish traders may continue their advance. The more tariffs Donald Trump introduces, the more the dollar will weaken. The deeper the Federal Reserve cuts interest rates in 2025, the more reasons traders will have to continue selling the U.S. dollar. The outlook for the U.S. currency appears unpromising.
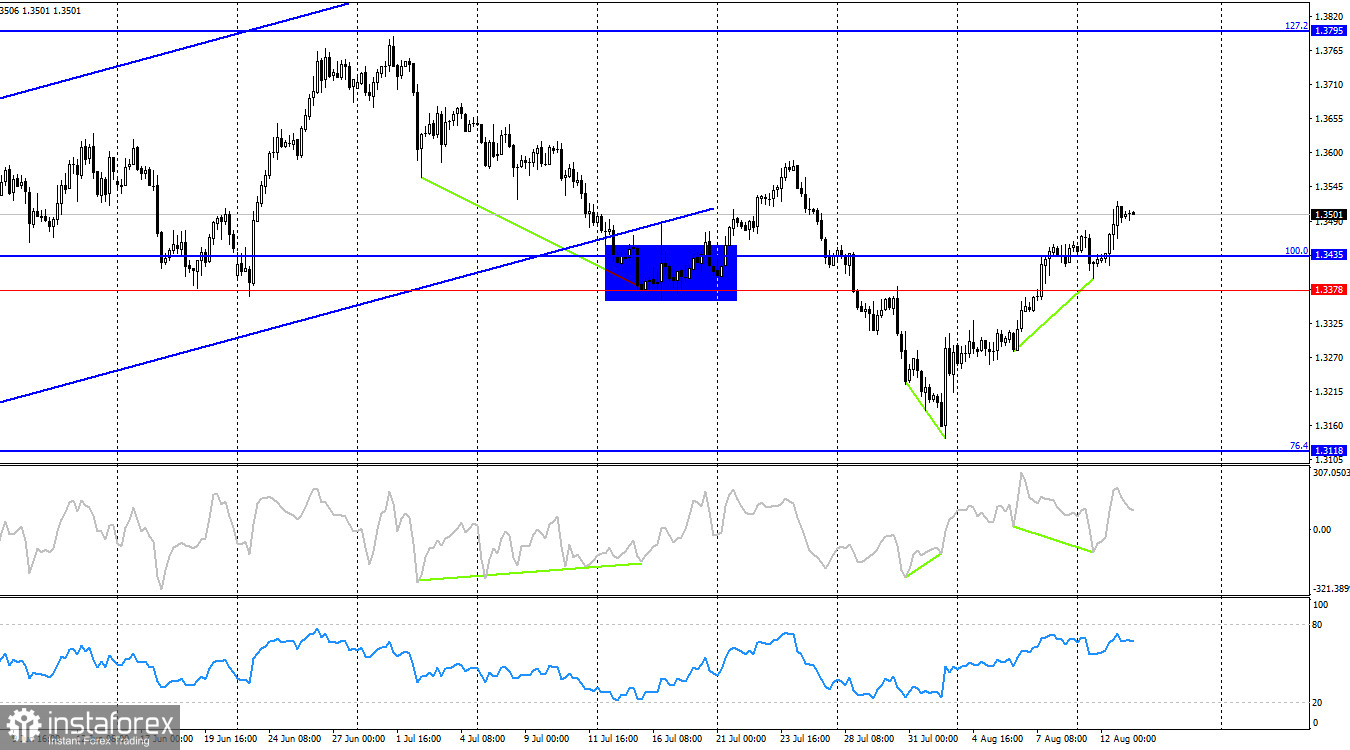
On the 4-hour chart, the pair reversed in favor of the pound after forming a bullish divergence in the CCI indicator and closing above the resistance zone of 1.3378–1.3435. This opens the way for further growth toward the next Fibonacci level at 1.3795. At present, no emerging divergences are observed in any indicator. A bullish trend may resume.
Commitments of Traders (COT) Report:
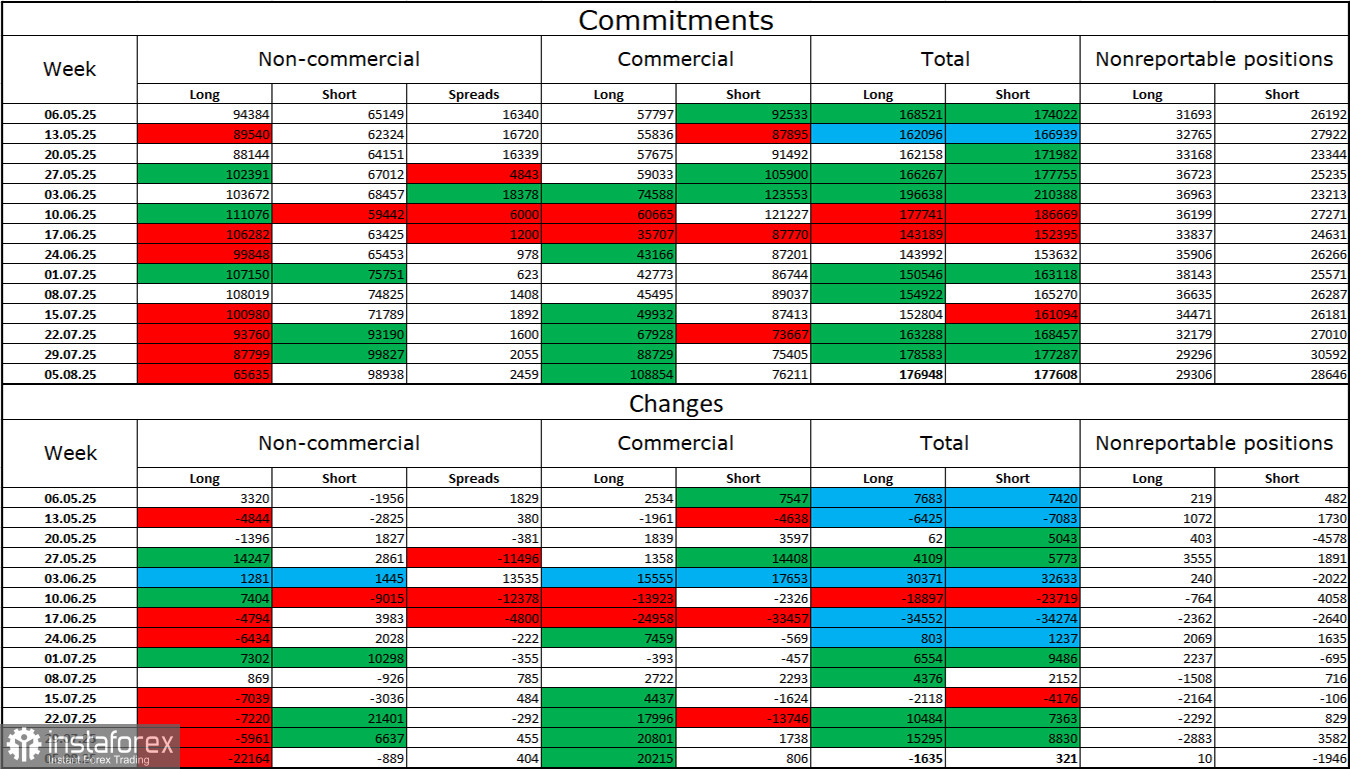
The sentiment of the "Non-commercial" category became more bearish over the last reporting week. The number of long positions held by speculators decreased by 22,164, while the number of short positions fell by 889. However, the sharp decline in interest in the pound indicated by the COT reports does not fully reflect the real market situation, as interest in the dollar is also falling. The current gap between the number of long and short positions is approximately 65,000 versus 98,000. Nevertheless, the pound continues to rise.
In my view, the pound still faces downside risks. The news background for the U.S. dollar during the first six months of the year was extremely unfavorable but is slowly starting to improve. Trade tensions are easing, key deals are being signed, and the U.S. economy is expected to recover in the second quarter due to tariffs and various types of investments in the United States. At the same time, prospects for further Fed monetary policy easing in the second half of the year could create significant pressure on the dollar.
News Calendar for the U.S. and the U.K.:
On August 13, the economic calendar contains no significant releases. The news background is unlikely to influence market sentiment today.
GBP/USD Forecast and Trading Recommendations:
Selling opportunities for the pair may arise today if the price closes below 1.3482 on the hourly chart, with targets at 1.3416–1.3425 and 1.3357–1.3364. For buying, a rebound from the 1.3114–1.3139 zone was required. These trades were previously recommended with targets at 1.3357–1.3371, 1.3425, and 1.3470 — all targets have been reached. Holding above 1.3482 allows for maintaining long positions with a target at 1.3586.
The Fibonacci grids are built from 1.3586–1.3139 on the hourly chart and from 1.3431–1.2104 on the 4-hour chart.

