यह भी देखें

 18.08.2025 11:42 AM
Trend Analysis.
This week, from the level of 1.3553 (the close of the last weekly candle), the price may start moving downward toward 1.3389 – the 23.6% retracement level (red dashed line). Upon testing this level, the price may rebound upward toward 1.3444 – the 13-period EMA (thin yellow line).
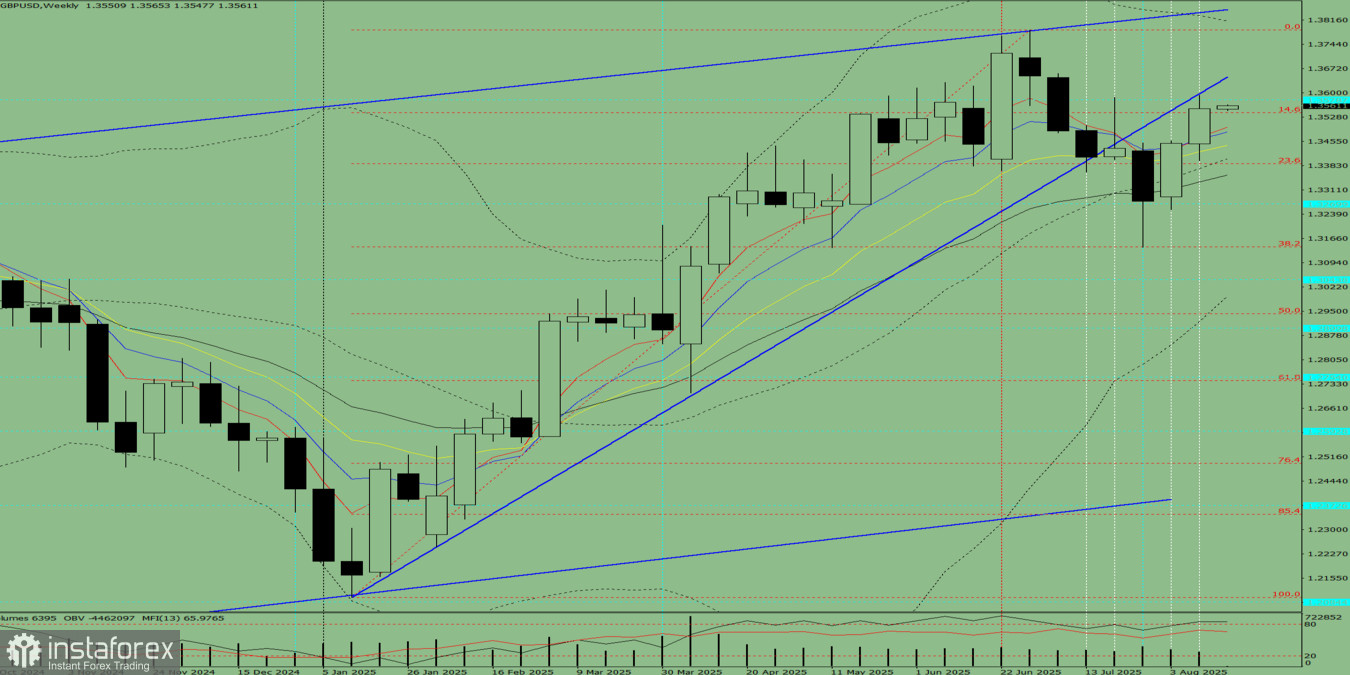
Fig. 1 (weekly chart).
Comprehensive Analysis:
Conclusion based on comprehensive analysis: downward movement.
Overall result of the weekly candlestick projection for GBP/USD: the price will most likely show a downward trend, with the weekly black candle lacking an initial upper shadow (Monday – downward) and forming a second lower shadow (Friday – upward).
Alternative scenario: From the level of 1.3553 (the close of the last weekly candle), the price may start moving downward toward 1.3270 – the historical support level (blue dashed line). Upon reaching this level, the price may then move upward toward 1.3355 – the 21-period EMA (thin black line).
You have already liked this post today
*यहां पर लिखा गया बाजार विश्लेषण आपकी जागरूकता बढ़ाने के लिए किया है, लेकिन व्यापार करने के लिए निर्देश देने के लिए नहीं |

