यह भी देखें

 19.08.2025 10:45 AM
Trend Analysis (Fig. 1).
On Tuesday, from the 1.1659 level (the closing price of yesterday's daily candle), the market may continue moving downward toward 1.1581 – the 38.2% retracement level (blue dashed line). Upon testing this level, the price may rebound upward, aiming to test the lower fractal at 1.1631 (daily candle of August 14, 2025).
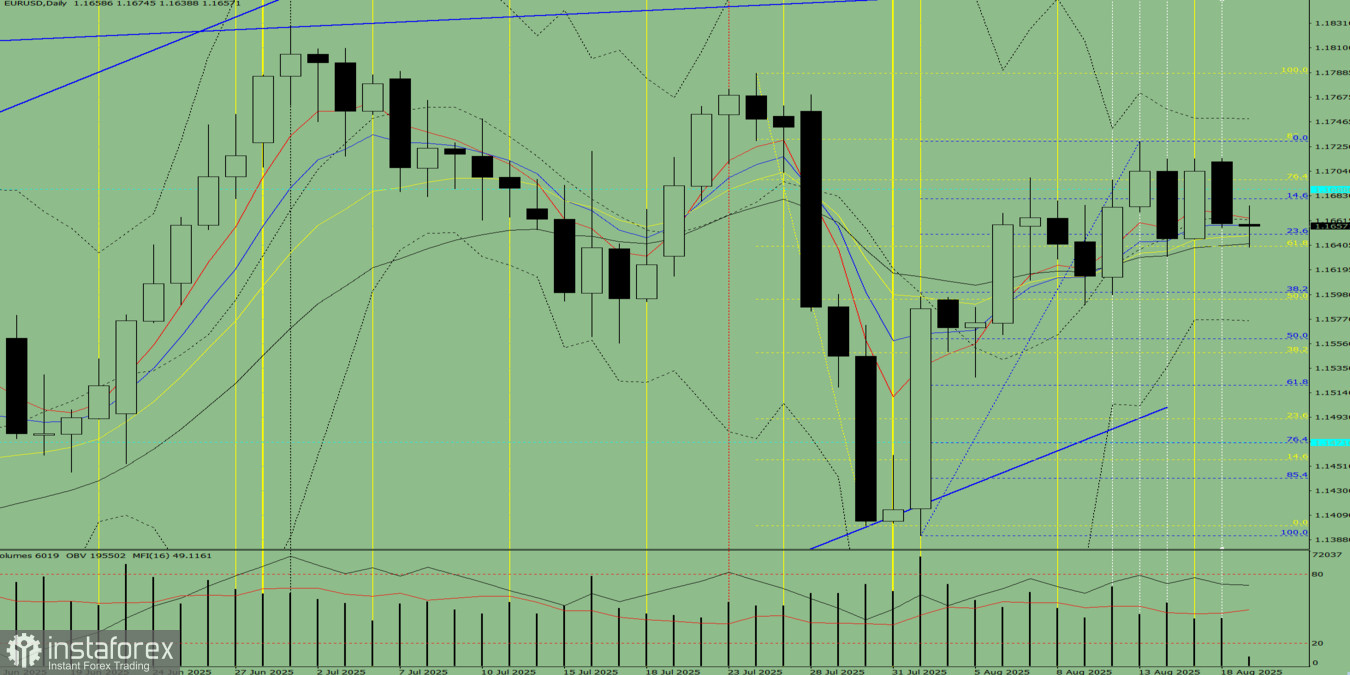
Fig. 1 (Daily Chart).
Comprehensive Analysis:
Overall conclusion: bearish trend.
Alternative scenario: From the 1.1658 level (closing price of yesterday's daily candle), the price may continue moving downward toward 1.1640 – the 61.8% retracement level (yellow dashed line). Upon testing this level, the price may rebound upward, aiming to test the 23.6% retracement level at 1.1650 (blue dashed line).
You have already liked this post today
*यहां पर लिखा गया बाजार विश्लेषण आपकी जागरूकता बढ़ाने के लिए किया है, लेकिन व्यापार करने के लिए निर्देश देने के लिए नहीं |

