यह भी देखें

 19.08.2025 10:47 AM
Trend Analysis (Fig. 1).
On Tuesday, from the 1.3500 level (closing price of yesterday's daily candle), the market may continue moving downward toward 1.3451 – the 21-day EMA (thin black line). Upon testing this line, the price may begin to move upward, aiming for 1.3481 – the 76.4% retracement level (red dashed line).
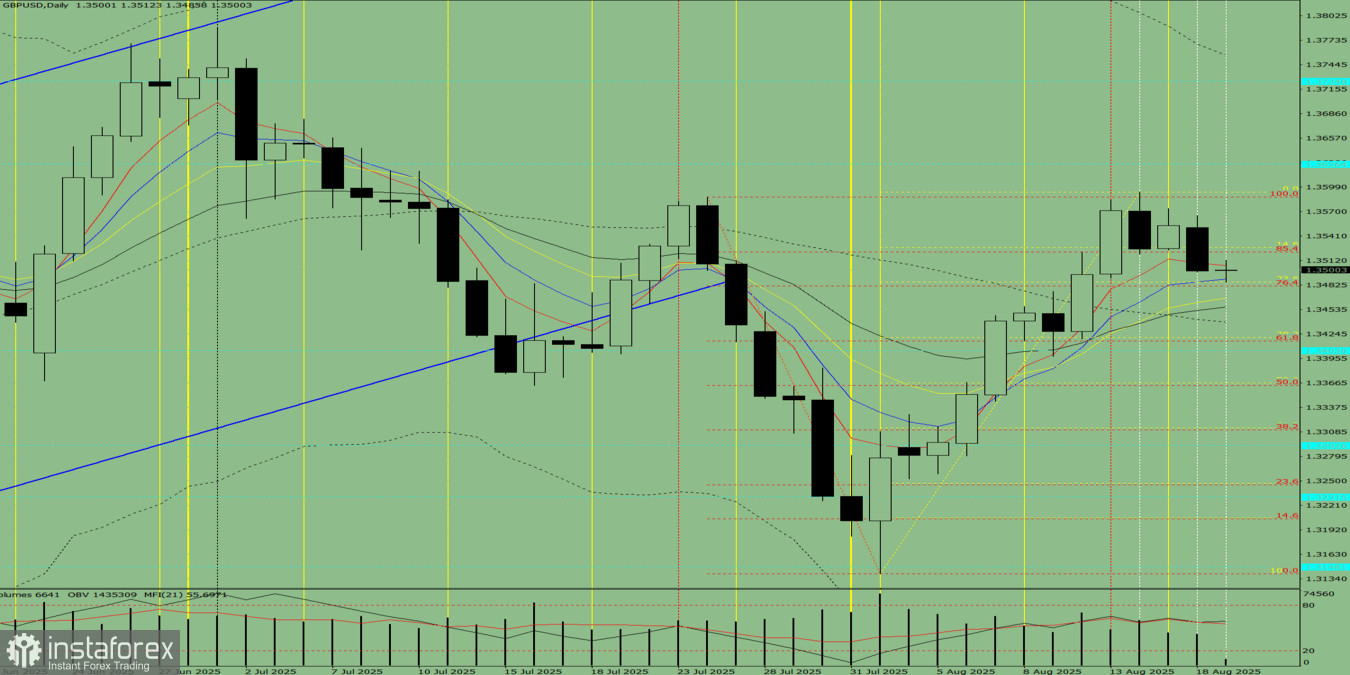
Comprehensive Analysis:
Overall conclusion: bearish trend.
Alternative scenario: From the 1.3500 level (closing price of yesterday's daily candle), the price may continue moving downward toward 1.3416 – the 61.8% retracement level (red dashed line). Upon testing this level, the price may begin to move upward, aiming for 1.3451 – the 21-day EMA (thin black line).
You have already liked this post today
*यहां पर लिखा गया बाजार विश्लेषण आपकी जागरूकता बढ़ाने के लिए किया है, लेकिन व्यापार करने के लिए निर्देश देने के लिए नहीं |

