यह भी देखें

 15.09.2025 11:57 AM
Trend analysis (Fig. 1).
This week, from the level of 1.1734 (the closing of the last weekly candle), the market may continue moving upward toward 1.1886 – the 161.8% target level (red dashed line). Upon testing this level, the price may retrace downward toward 1.1828 – the upper fractal (blue dashed line).
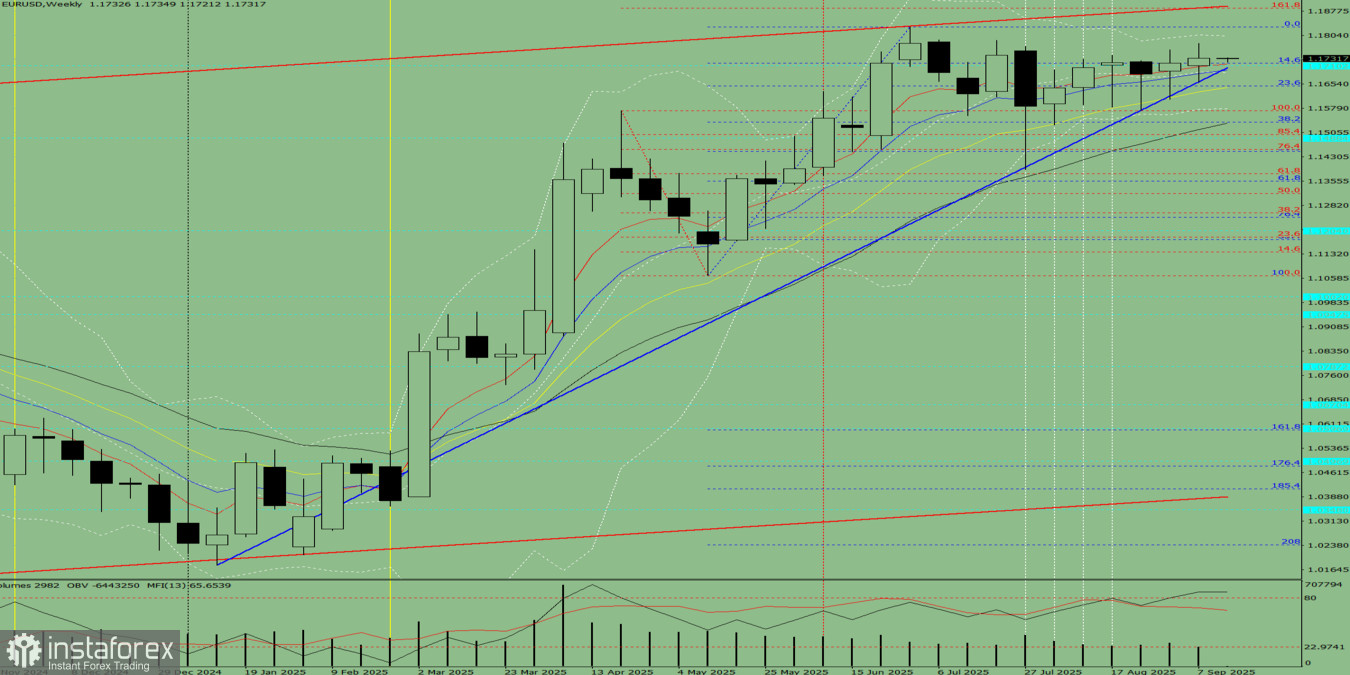
Fig. 1 (weekly chart).
Comprehensive analysis:
Conclusion from comprehensive analysis: upward trend.
Overall summary of EUR/USD weekly candle calculation: during the week, the price is most likely to show an upward trend with the absence of a lower shadow on the weekly white candle (Monday – upward) and the presence of an upper shadow (Friday – downward).
Alternative scenario: from the level of 1.1734 (the closing of the last weekly candle), the pair may continue moving upward toward 1.1828 – the upper fractal (blue dashed line). Upon testing this level, the price may retrace downward toward 1.1717 – the 14.6% retracement level (blue dashed line).
You have already liked this post today
*यहां पर लिखा गया बाजार विश्लेषण आपकी जागरूकता बढ़ाने के लिए किया है, लेकिन व्यापार करने के लिए निर्देश देने के लिए नहीं |

