यह भी देखें

 19.09.2025 11:12 AM
Trend analysis (Fig. 1).
On Friday, the market from the level of 1.1788 (yesterday's daily candle close) may continue moving downward toward the target of 1.1727 – the 21-period EMA (black thin line). When testing this line, a corrective upward movement is possible with a target of 1.1751 – the 13-period EMA (yellow thin line).
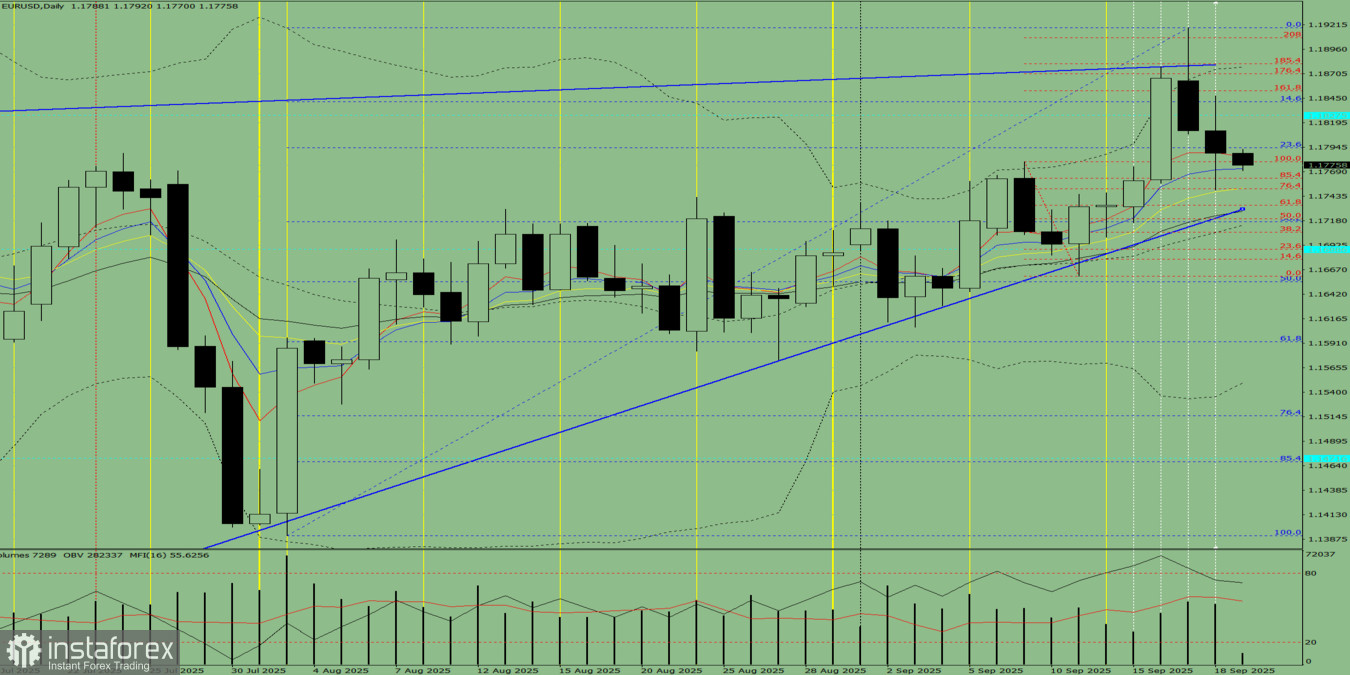
Fig. 1 (daily chart).
Comprehensive analysis:
General conclusion: downward trend.
Alternative scenario: Today, from the level of 1.1788 (yesterday's daily candle close), the price may start moving downward toward the target of 1.1751 – the 13-period EMA (yellow thin line). When testing this line, a corrective upward movement is possible with a target of 1.1762 – the 85.4% retracement level (red dashed line).
You have already liked this post today
*यहां पर लिखा गया बाजार विश्लेषण आपकी जागरूकता बढ़ाने के लिए किया है, लेकिन व्यापार करने के लिए निर्देश देने के लिए नहीं |

