यह भी देखें

 05.11.2025 07:30 AM
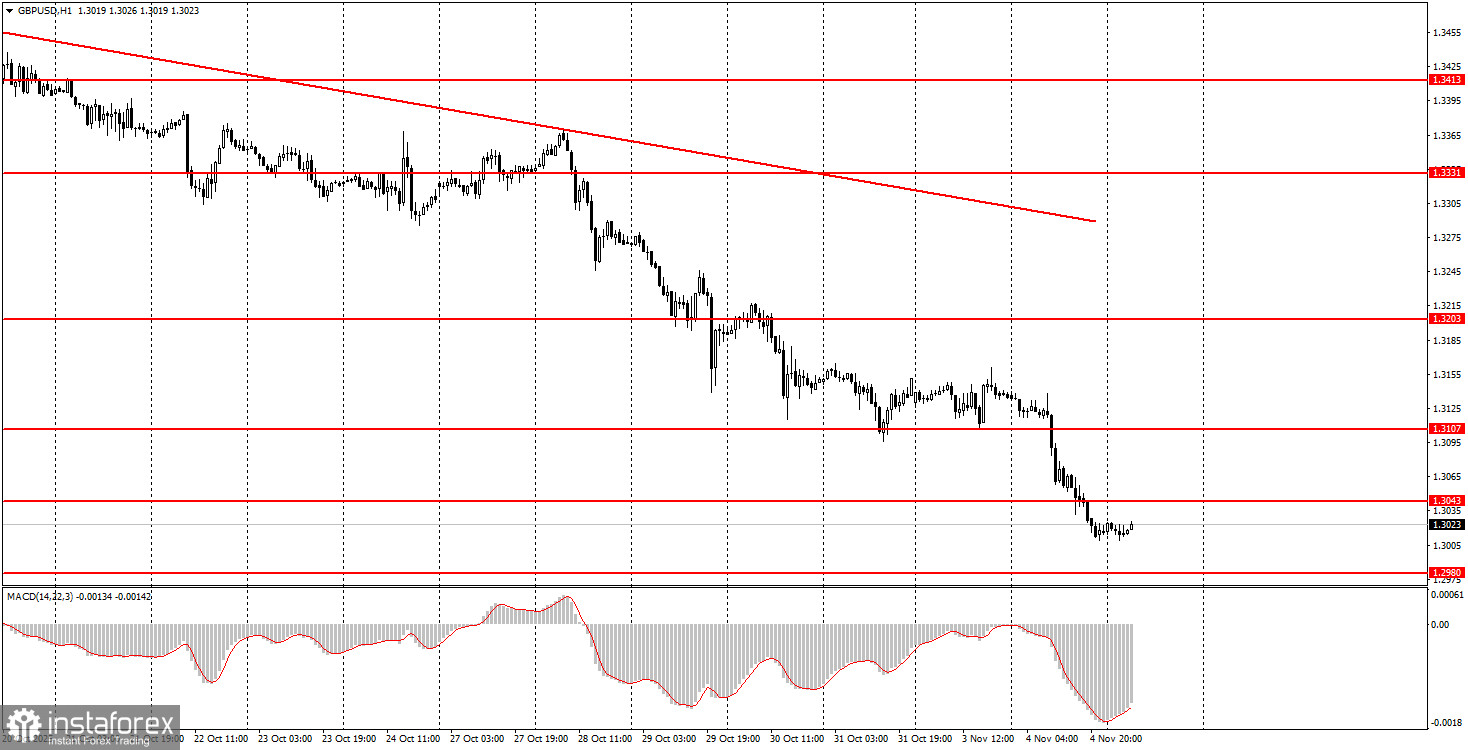
The GBP/USD pair continued its downward movement on Tuesday. This time, the decline of the British currency was "provoked" by a new speech from the UK Chancellor of the Exchequer, Rachel Reeves. It's noteworthy that in recent months, almost every speech by Reeves triggers a crash in the British currency. Initially, such market reactions could be seen as justified, but yesterday they were not. The British pound has been falling for over a month for absolutely any reason. Even when no reasons exist, it continues to decline. Therefore, the new speech from Reeves was just another excuse for the pound to drop even lower. Reeves reported yesterday morning that the government would need to make "difficult decisions" in the new budget for next year and that some taxes would be increased. However, discussions about tax hikes in the UK have been ongoing since the summer. This news is not new. Yet, the market still uses any formal reason to sell.
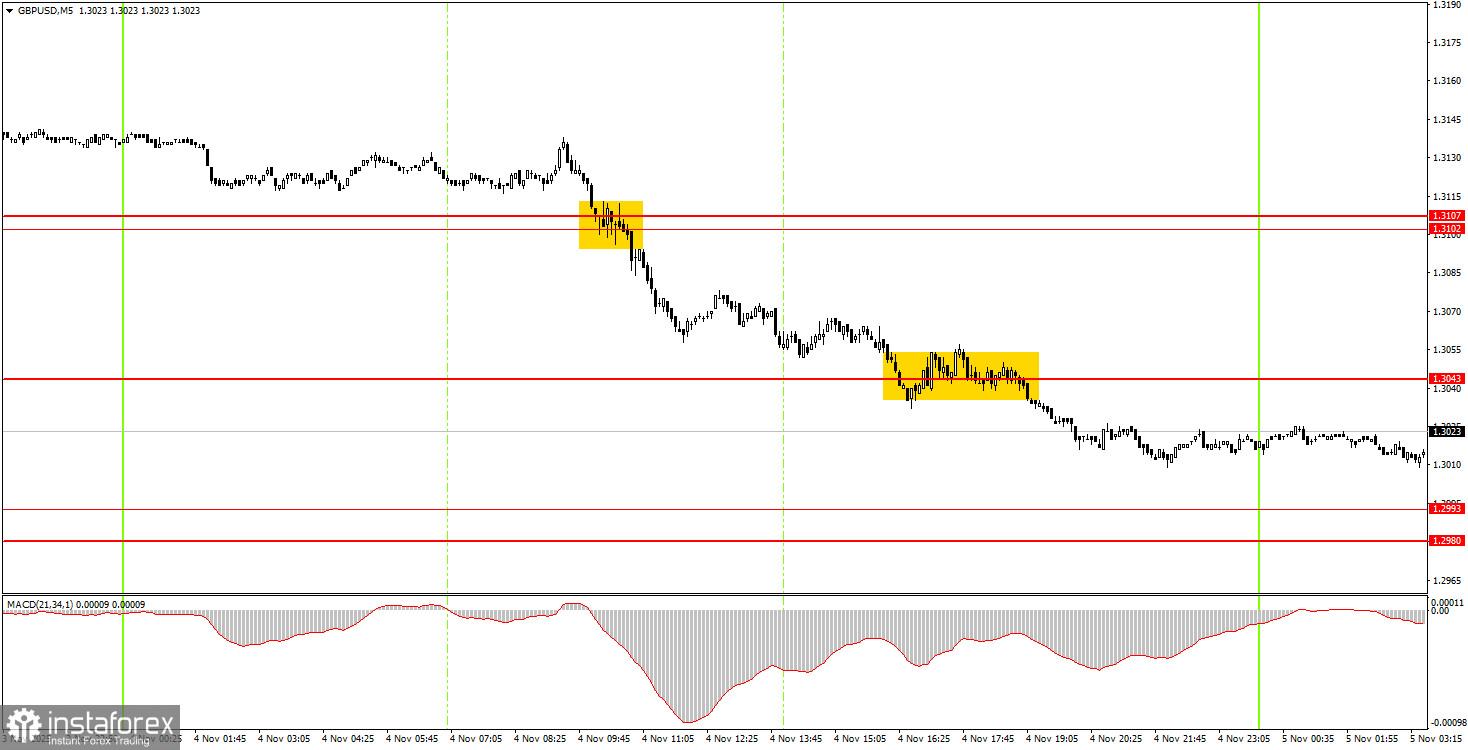
On the 5-minute timeframe, two decent sell signals were formed on Tuesday. During the European trading session, the area of 1.3102-1.3107 was breached, prompting the pair to drop to 1.3043 during the American session. It subsequently breached that level as well. Thus, novice traders had reasons to open short positions in the morning, and by the end of the day, they could have locked in a profit of about 70 pips.
On the hourly timeframe, the GBP/USD pair continues to form a new downward trend. The British pound is declining again for absolutely any reason. As we mentioned earlier, there are no grounds for a prolonged rise in the dollar, so we expect only upward movement in the medium term. However, the flat factor in the long term continues to pull the pair down —an absolutely illogical development.
On Wednesday, novice traders can comfortably trade in the range of 1.2980-1.2993 or at the 1.3043 level, between which the pair is currently trading. Overall, even from a technical standpoint, this downward movement has long been overdue for a conclusion.
On the 5-minute timeframe, trading can currently be done at 1.2913, 1.2980-1.2993, 1.3043, 1.3102-1.3107, 1.3203-1.3211, 1.3259, 1.3329-1.3331, 1.3413-1.3421, 1.3466-1.3475, 1.3529-1.3543, 1.3574-1.3590. On Wednesday, there are no significant reports or events scheduled in the UK, whereas in the US, the ISM manufacturing index and the ADP report on private sector employment changes will be released. These are important reports, but will the market take notice?
Important speeches and reports (always available in the news calendar) can significantly impact the movement of the currency pair. Therefore, during their release, trading should be done with maximum caution, or traders should exit the market to avoid a sharp reversal in price against the preceding movement.
Beginners trading in the Forex market should remember that not every trade can be profitable. Developing a clear strategy and money management are keys to success in trading over the long term.

