यह भी देखें

 12.11.2025 10:22 AM
Trend Analysis (Fig. 1)
On Wednesday, the market may begin moving upward from the 1.3146 level (yesterday's daily candle close) toward the target of 1.3232 — a historical resistance level (blue dashed line). When testing this level, the price may pull back downward toward 1.3217 — the 21-day EMA (black thin line).
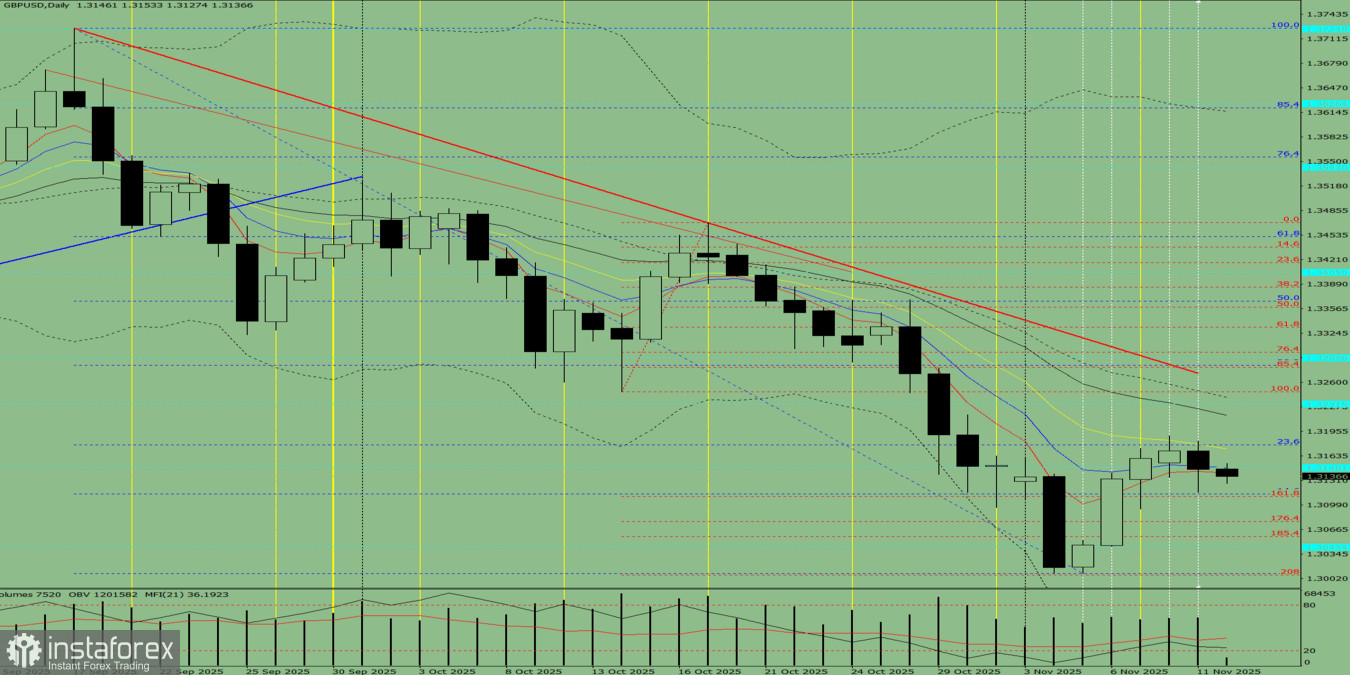
Fig. 1 (Daily Chart)
Comprehensive Analysis
General conclusion: upward trend.
Alternative Scenario
On Wednesday, the market may begin moving upward from the 1.3146 level (yesterday's daily candle close) toward the target of 1.3217 — the 21-day EMA (black thin line). When testing this line, the price may pull back downward toward 1.3178 — the 23.6% retracement level (blue dashed line).
You have already liked this post today
*यहां पर लिखा गया बाजार विश्लेषण आपकी जागरूकता बढ़ाने के लिए किया है, लेकिन व्यापार करने के लिए निर्देश देने के लिए नहीं |

