यह भी देखें

 05.03.2026 04:12 AM
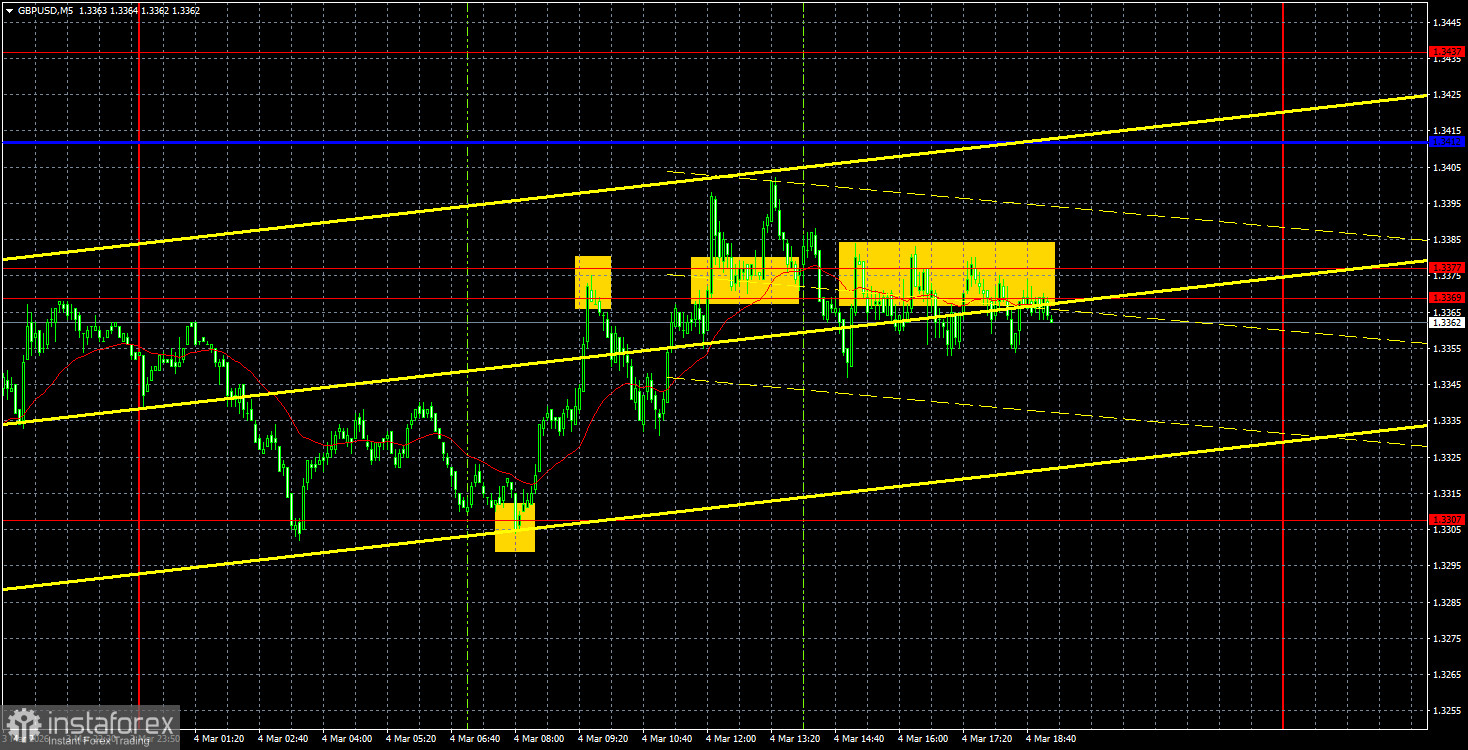
The GBP/USD currency pair continued its upward correction on Wednesday, which began on Tuesday. However, looking at the price movements on the hourly or 5-minute timeframe may present a disturbing picture. During the European trading session, the price moved higher with relative confidence. What began during the American session could have been alarming. It feels like the British pound has rumbled through a plowed field when observing these movements. Naturally, the market paid no attention to the ADP and ISM reports from the US, which is not surprising. Traders have been diligently ignoring many reports, events, and news lately. In the past day and a half, we've only seen a pause in the decline of the GBP/USD pair. There is still no confidence that the decline has ended.
From a technical standpoint, the hourly timeframe indicates a trend, but there are no technical benchmarks. It is currently impossible to form a trend line or channel. Moreover, the price could continue to rise for a couple more days, only to fall sharply on Friday's Nonfarm Payrolls or unemployment data. Or, it could be the opposite. No one knows how events in the Middle East will unfold or to which other continents the war will spread. The market is living in complete uncertainty and is simply reacting to events as they occur in real time. Predicting anything is impossible.
On the 5-minute timeframe, several trading signals were identified. Two decent signals were formed during the European trading session. At the start, the price accurately bounced off the 1.3307 level, then from the 1.3369-1.3377 area. After that, normal movements ended, and the price seemed trapped in a meat grinder.
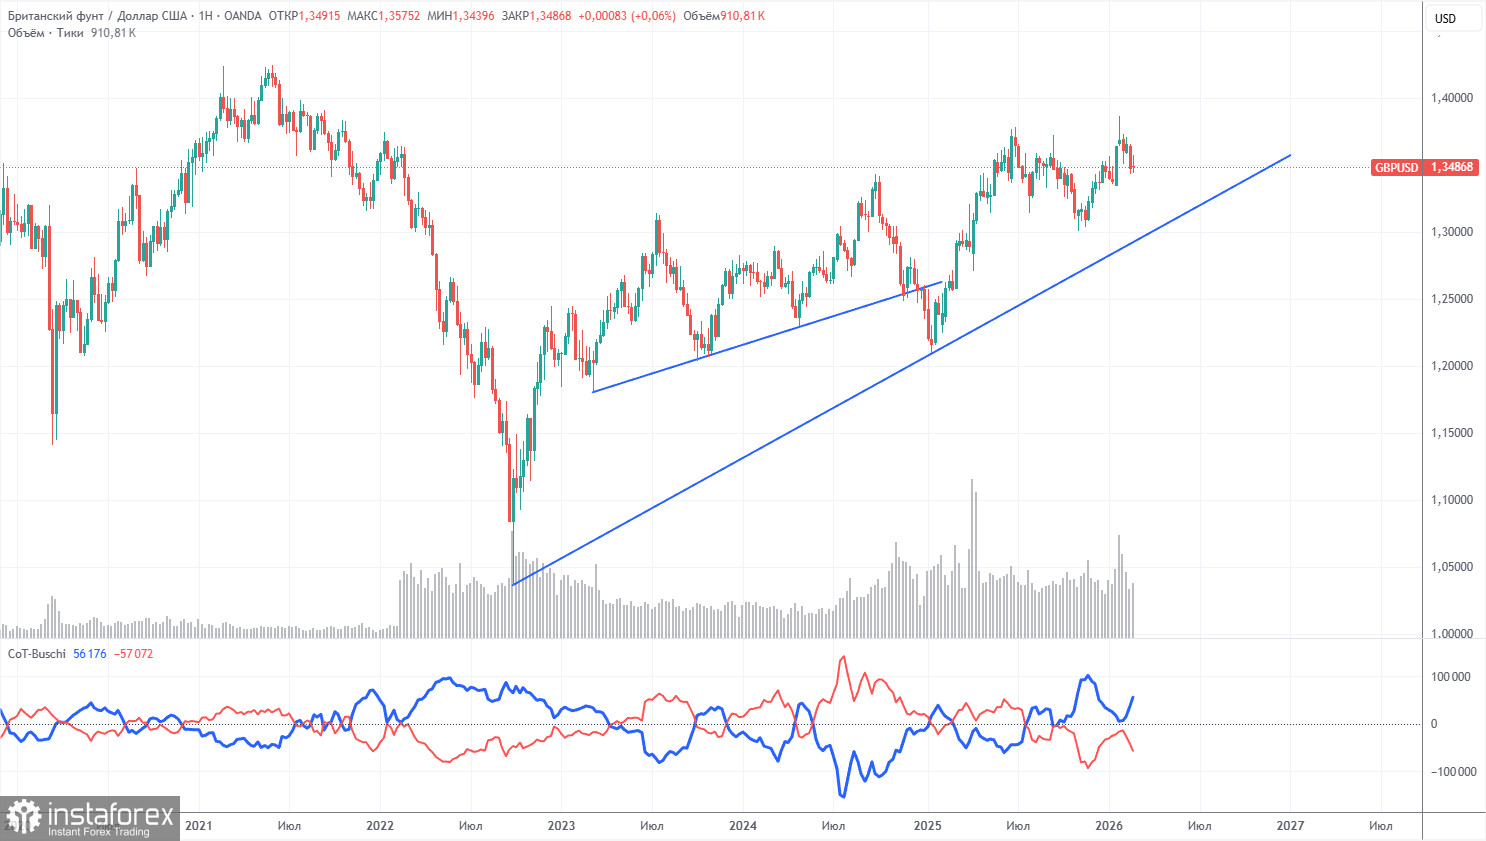
COT reports for the British pound indicate that sentiment among commercial traders has been changing steadily in recent years. The red and blue lines representing the net positions of commercial and non-commercial traders frequently cross each other and are mostly close to the zero mark. Currently, the lines are approaching each other, with non-commercial traders still dominating with... sales. Recently, speculators have actively increased long positions; however, they have not yet managed to move into a zone of superiority.
The dollar continues to decline due to Donald Trump's policies, as is clearly visible on the weekly timeframe (illustration above). The trade war will continue in one form or another for a long time, and the Fed will inevitably lower rates in the next 12 months. Demand for the dollar will decline one way or another. According to the latest COT report (dated February 24) regarding the British pound, the "Non-commercial" group closed 14,800 contracts in buys and 100 contracts in sells. Thus, the net position of non-commercial traders decreased by another 14,700 contracts over the week.
In 2025, the pound rose significantly, but it is essential to understand that this was due to a singular factor—Trump's policies. Once this factor is addressed, the dollar may begin to rise. But when that will happen is unknown.
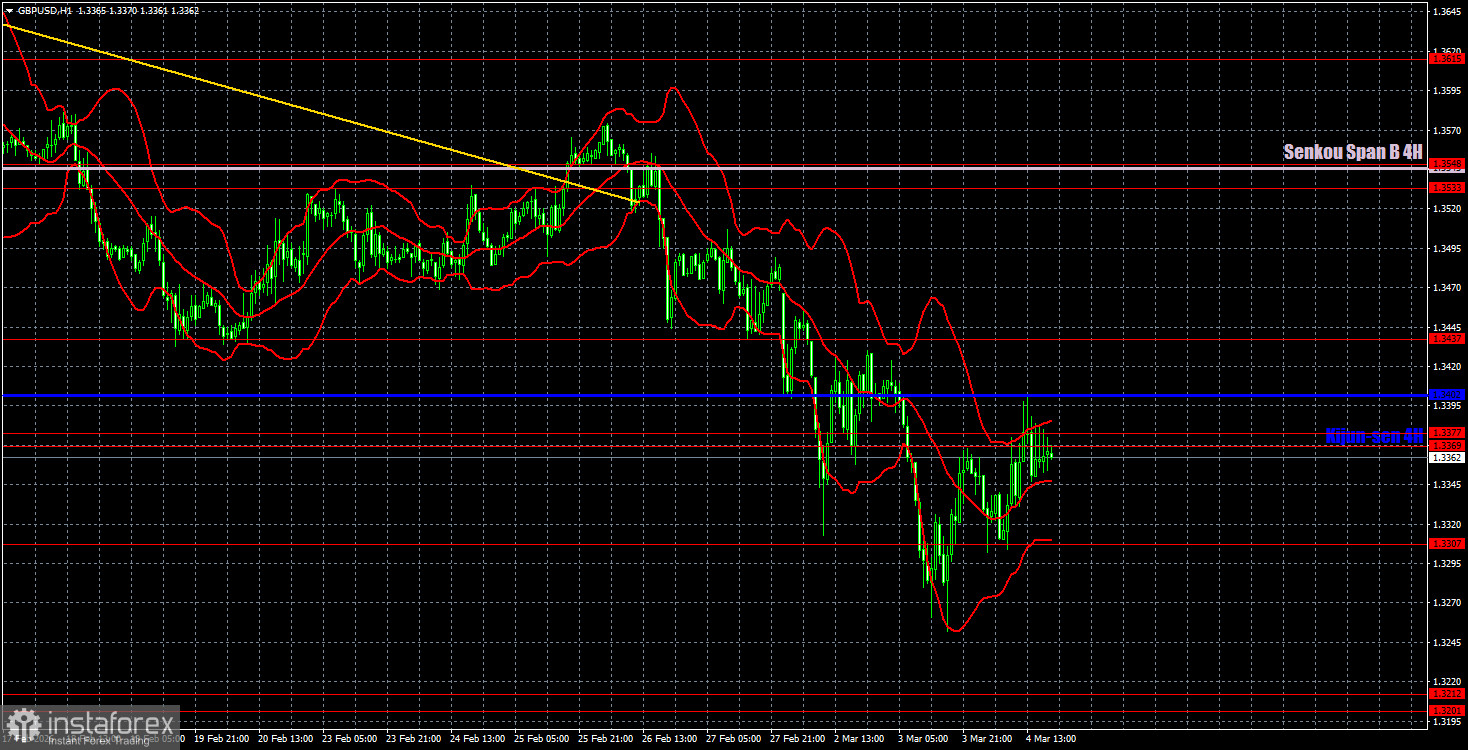
On the hourly timeframe, the GBP/USD pair could have previously transitioned to forming an upward trend, but geopolitics have dragged the British pound into a downward spiral. Despite the strong decline of the pair in February and March, we still regard it as a correction. The daily timeframe confidently signals the preservation of the upward trend. Unfortunately, geopolitics is highly unpredictable and can dramatically shift market sentiment, as we are witnessing now.
For March 5, we identify the following important levels: 1.3096-1.3115, 1.3201-1.3212, 1.3307, 1.3369-1.3377, 1.3437, 1.3533-1.3548, 1.3615, 1.3671-1.3681, 1.3751-1.3763. The Senkou Span B line (1.3545) and Kijun-sen (1.3402) may also serve as sources of signals. It is recommended to set the Stop Loss order to breakeven if the price moves in the correct direction by 20 pips. The Ichimoku indicator lines may shift during the day, which should be taken into account when determining trading signals.
On Thursday, no significant events are scheduled in the UK, while in the US, a report on unemployment claims will be released. This report often receives little attention from traders, even in calm times, and today it is unlikely anyone will pay attention to it.
Today, traders may open new short positions with targets of 1.3307 and 1.3201-1.3212 if the pair bounces from the area of 1.3369-1.3377. Long positions will become relevant with targets at the Kijun-sen line and level 1.3437 if the price breaks through the area of 1.3369-1.3377.

