
यह भी देखें


 12.10.2026 08:07 AM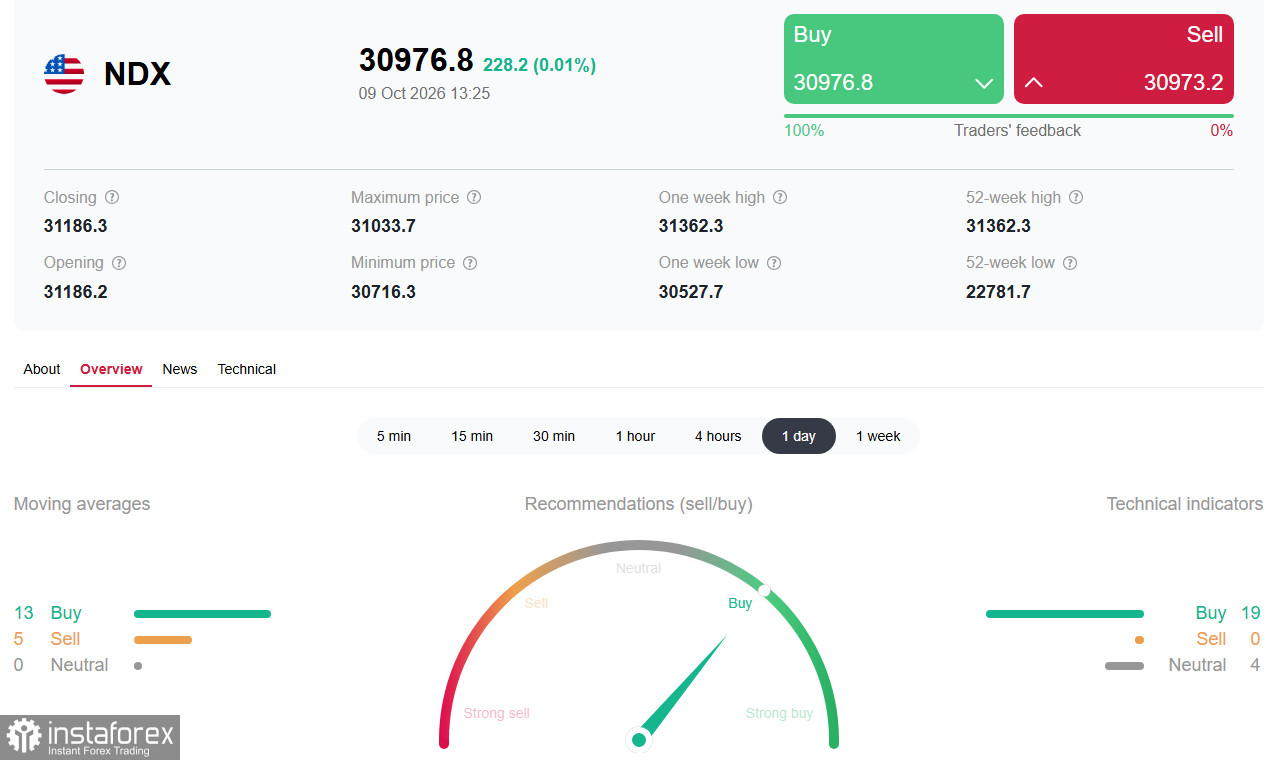
*see also: InstaTrade trading indicators for the NASDAQ 100 (NDX)
At the start of the US session on Friday, the NASDAQ 100 is trading around 31,000.0 points, attempting to recover from Thursday's sharp 1.39% drop. The sell-off was triggered by disappointing OpenAI revenue data that called into question valuations of AI-related companies. By Friday morning, NASDAQ 100 futures had gained about 0.7–0.8% after reports that OpenAI expects to reach $70 billion in annual revenue by year-end.
Tech sector sell-off. On Thursday, the NASDAQ 100 fell by 1.39%. The trigger was reporting that OpenAI's annualized revenue stood at $50 billion as of the end of September, well below the widely cited $68 billion figure that included partners' gross receipts. The discrepancy reignited questions about how AI companies recognize revenue and justify massive capex.
Friday rebound. NASDAQ 100 futures rose by roughly 0.75–0.82% after Bloomberg reported OpenAI expects to reach or exceed $70 billion in annual revenue by year-end, driven by corporate sales. That eased concerns that the AI boom might be less profitable than previously thought.
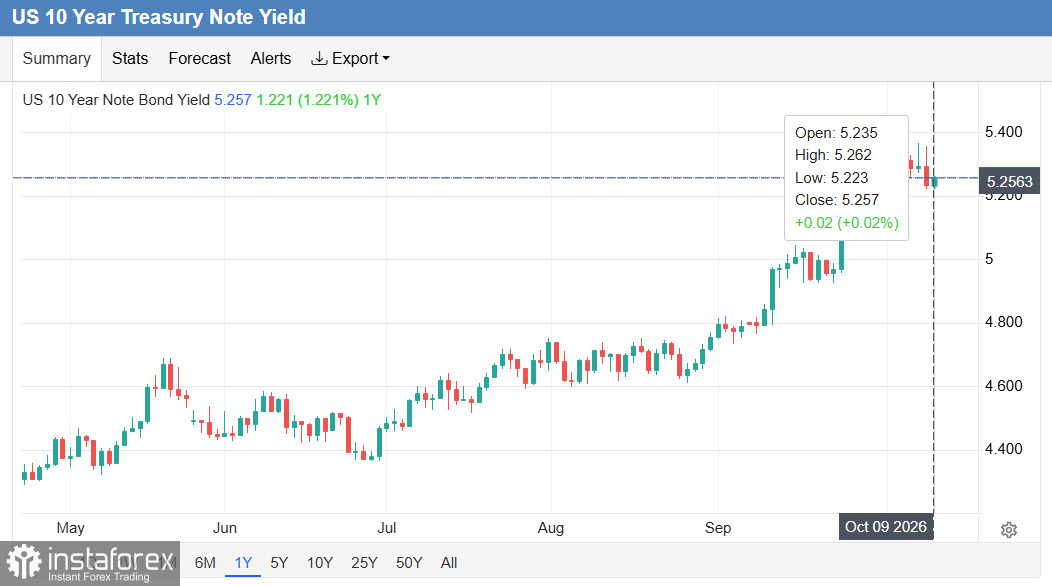
Yields stabilized. The 10-year US Treasury yield pulled back from Thursday's 24-year high of 5.35% and is trading around 5.23–5.26% today. A successful 30-year auction on Thursday calmed markets, showing investors remain willing to buy long-dated US debt even at elevated yields.
Oil remains a pressure point. Brent is holding above $101/bbl and WTI around $89–91. US President Donald Trump said the US will refrain from striking Iran before the midterms, which trimmed the geopolitical risk premium slightly but did not remove uncertainty.
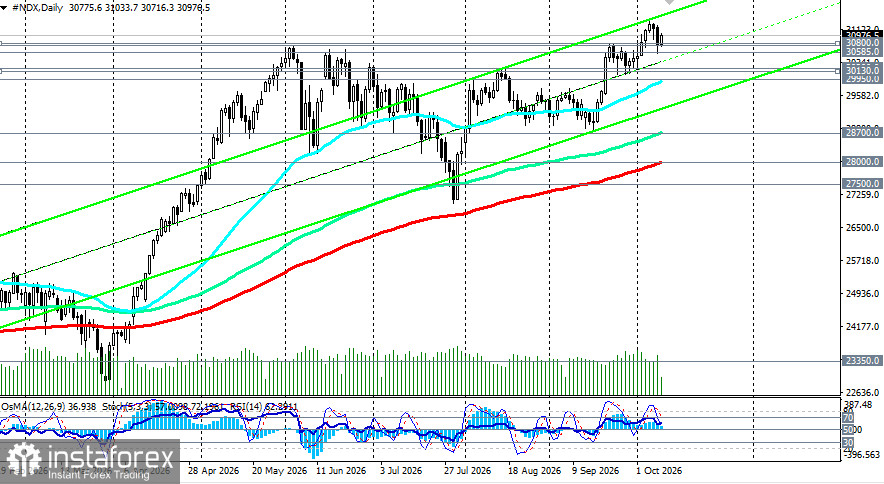
The technical outlook remains bullish. The index is trading above key short- and long-term moving averages, suggesting that the correction may be complete and the uptrend is resuming.
InstaTrade's composite technical analysis (daily chart) signals "Buy": 19 of 23 indicators favor buyers.
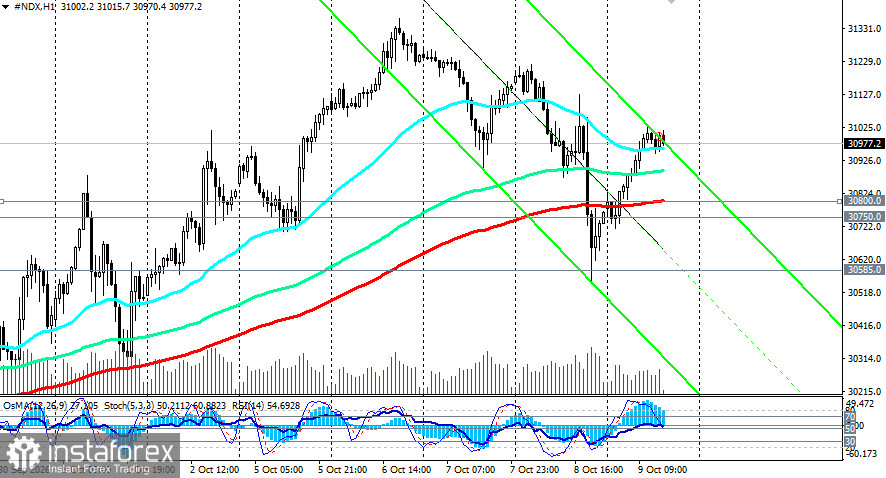
The index is testing resistance in the 30,900.0–31,050.0 zone. A sustained break above it would open the way to 31,800.0–32,000.0. A break below 30,850.0 could trigger a fresh wave of correction, while a break of 30,500.0 would signal a reversal of the short-term trend.
Main question of the week — can the NASDAQ 100 hold support at 30,800.0 amid the University of Michigan consumer sentiment release? Better-than-expected sentiment would support risk appetite; worse would amplify growth slowdown concerns.
Today, October 9, at 14:00 GMT, the preliminary University of Michigan consumer sentiment index for October is due. Consensus is 47.6 versus 48.1 in September. Pay particular attention to the inflation expectations component: one-year expectations are currently 4.6%, and five-year expectations are 3.4%. If one-year expectations rise above 4.6%, that could revive fears of Fed tightening and pressure tech stocks.
On Wednesday, October 14, at 12:30 GMT, the September consumer price index (CPI) will be released. That's the key release that will determine whether the odds of a December Fed hike remain elevated. Soft prints would support the NASDAQ 100; strong prints would increase downside pressure.
Earnings season kicks off next week. Investors will watch tech giants closely for commentary on AI capex and its impact on profits. Weak results could trigger another sector sell-off.
Also watch bond yields. If 10-year yields hold below 5.25%, that will support growth stock valuations. If yields climb back toward 5.35%, pressure on NASDAQ100 will intensify.
The NASDAQ 100 is attempting to recover after the sell-off driven by OpenAI revenue concerns. Key level for bulls remains 31,230.0; for bears — 30,800.0.
For short-term traders:
For medium?term investors:
Risk management:
*This overview is based on public sources and media reports and reflects price dynamics driven by multiple factors; risk management and position control are essential.

