
यह भी देखें


 20.10.2026 04:26 AM
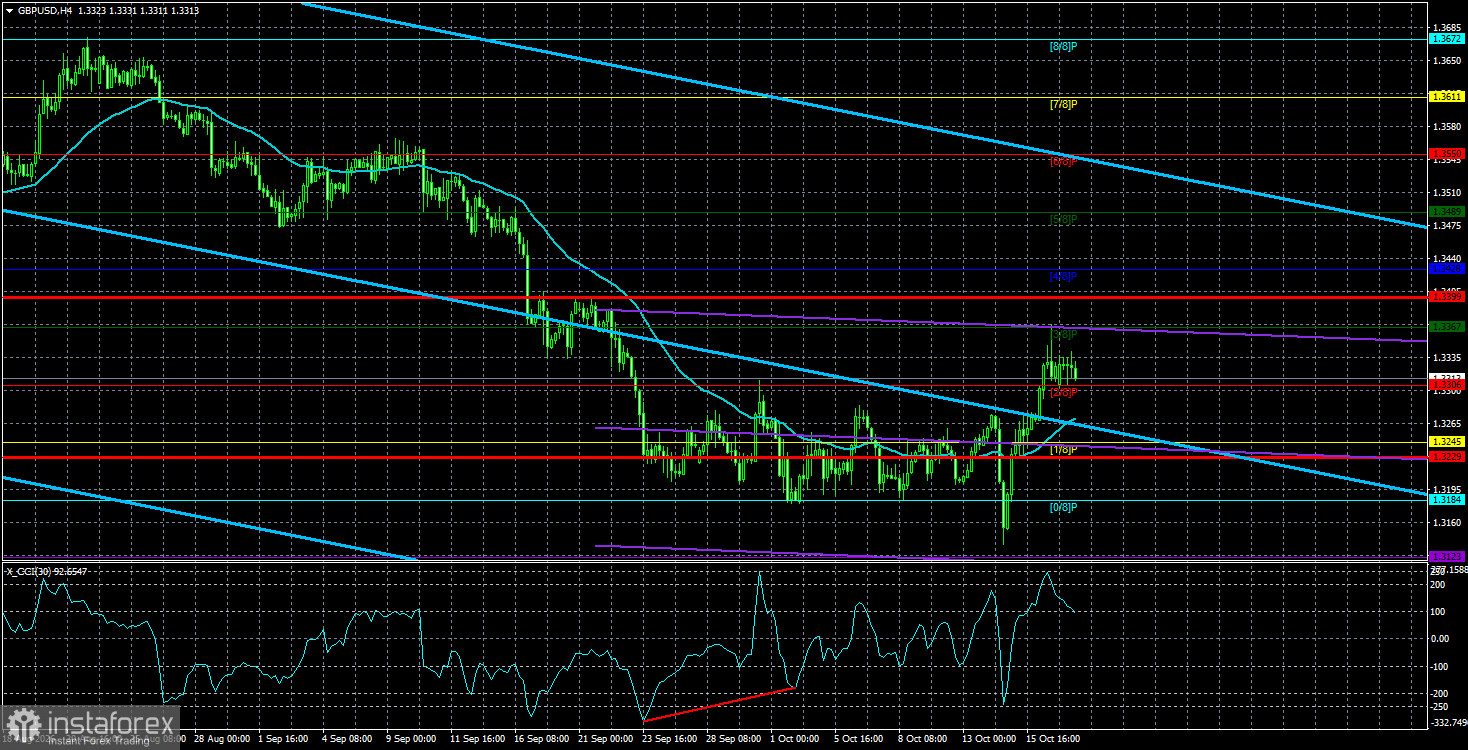
The GBP/USD currency pair traded fairly quietly on Monday, as expected. The riots and nationwide unrest didn't hit the pound, so it didn't drop significantly. That said, it would be wrong to say nothing interesting is happening in the UK. Over the past two years we have often used the phrase "American farce," because events in the US sometimes took on a comic character. It turns out the UK has its own state-level stand-up.
New UK prime minister Andy Burnham said the government could consider the option of the country rejoining the European Union. Burnham argued that Brexit has done more harm than good and that the country needs to change course. Those two statements alone deserve close scrutiny.
Start with the fact that the UK has had seven or eight prime ministers over the past ten years, and none of them has completed a full term. That happens because each new leader has been unable to restore the country to a path of prosperity. In 2016 Brits voted to leave the EU by about a 3% margin, and the UK formally exited the bloc a few years later. By 2020–2021 some analysts were already saying the people had clearly made the wrong decision. Five years ago it became apparent that life outside the EU was harder for Britain. But you cannot hold referendums every few years — at least that was Boris Johnson's response to Edinburgh's request to hold a referendum on Scottish independence.
Indeed, after Brexit, Scotland wanted to leave the United Kingdom and rejoin the EU. Later, Wales and Northern Ireland also expressed desires to join the bloc without the rest of the UK, while Britain sought full independence. Recently, Wales, Northern Ireland and Scotland passed laws allowing future referendums. The United Kingdom risks breaking up after separating from a powerful economic and trading bloc.
So the new prime minister has chosen a dramatic gambit: if living outside the EU does not work, then return to the EU. For now, this is talk, but the longer it goes on, the clearer it becomes to many Brits that life inside the European Union was better. Protests in France are underway over the rising cost of living; remember that the UK also faces a high cost of living. It appears we should expect unrest and protests in Britain too before anything politically changes.
Sterling has good chances to rise further, and technicals are its main friend right now. On the daily and weekly charts, the pair has begun moving from the lower edge of a sideways channel toward the upper edge, and we expect that move to continue.
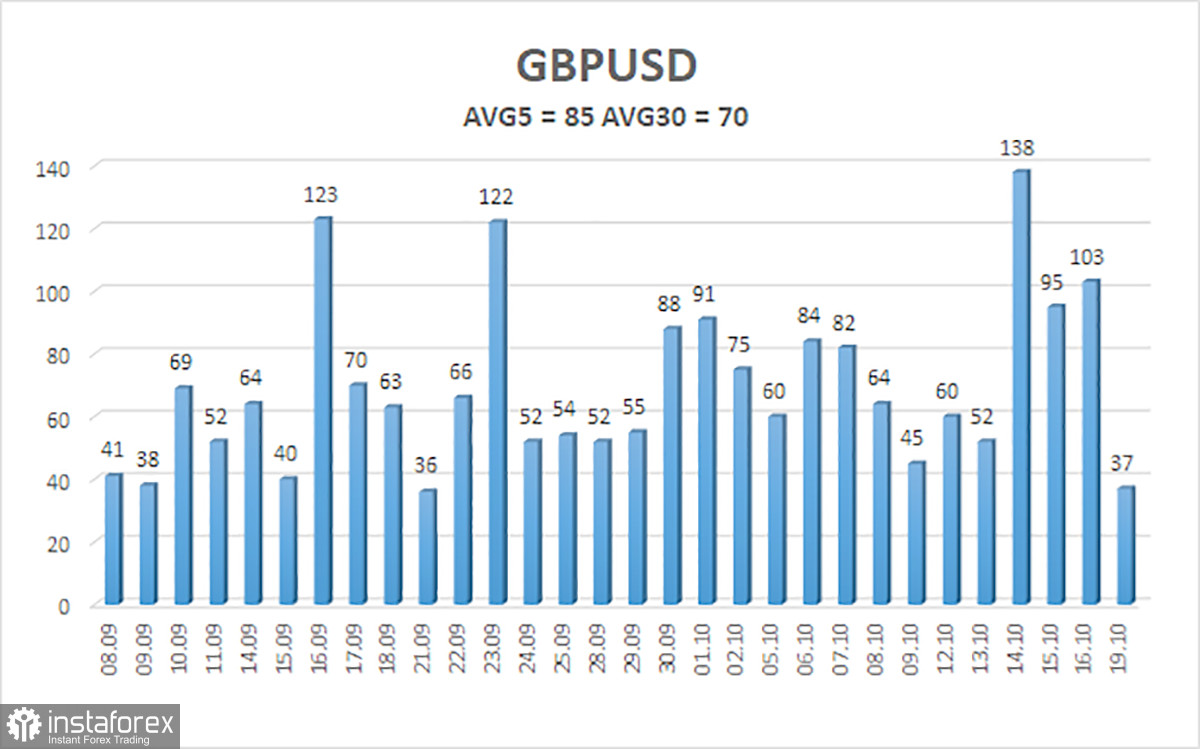
The average volatility of the GBP/USD pair over the last 5 trading days as of October 20 is 85 pips, which we classify as "average." We expect the pair to move inside a range bounded by 1.3229 and 1.3399 on Tuesday, October 20. The higher linear-regression channel has turned down again. The CCI entered the oversold area twice and formed a "bullish" divergence, which warns of a possible end to the downtrend. However, the market has responded only weakly to technical signals so far.
S1 – 1.3306
S2 – 1.3245
S3 – 1.3184
R1 – 1.3367
R2 – 1.3428
R3 – 1.3489
GBP/USD has begun an upward move that could develop into a longer-term trend. Donald Trump's policies will continue to exert pressure on the US economy, so we do not expect long-term dollar strength. So far, 2026 has been favorable for the dollar because geopolitics and inflation forced capital to seek safety and prompted the Fed to return to monetary tightening. However, on the weekly timeframe, a flat range between 1.3150 and 1.3780 persists within a four-year uptrend, supporting expectations for medium-term sterling appreciation. Consider long positions with targets of 1.3367 and 1.3399 if price is above the moving average. If price is below the moving average, consider bearish trading, with targets of 1.3229 and 1.3184.

