वास्तविक पैटर्न

पैटर्न ग्राफिकल मॉडल हैं जो चार्ट में मूल्य से बने होते हैं। तकनीकी विश्लेषण भविष्यवाणियों में से एक के अनुसार, इतिहास का मतलब मूल्य आंदोलन खुद को दोहराता है। इसका मतलब है कि मूल्य आंदोलन अक्सर एक ही परिस्थितियों में समान होते हैं जो उच्च संभावना के साथ स्थिति के आगे के विकास की भविष्यवाणी करना संभव बनाता है।
इंस्टा फॉरेक्स द्वारा प्रासंगिक पैटर्न एक उपयोग में आसान सेवा है जो आपको बाजार में नवीनतम परिवर्तनों के बारे में जागरूक होने और समय पर बाजार से संकेतों पर प्रतिक्रिया करने की अनुमति देती है। हमारी सेवा में आप हमेशा किसी भी जोड़ी और किसी भी समय सीमा पर नवीनतम और सबसे प्रासंगिक पैटर्न प्राप्त कर सकते हैं.
Bearish Symmetrical Triangle
was formed on 19.06 at 15:37:43 (UTC+0)
signal strength 3 of 5
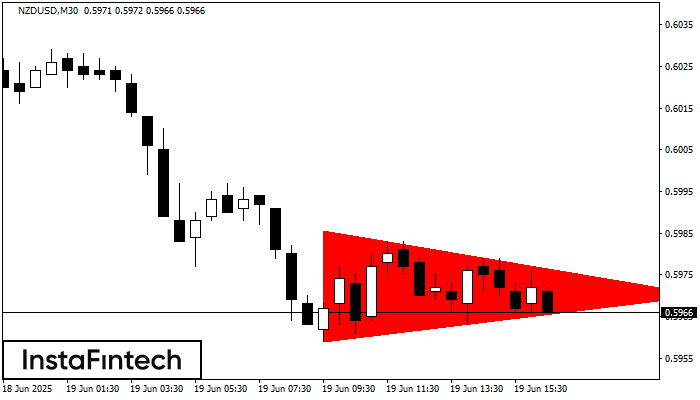
According to the chart of M30, NZDUSD formed the Bearish Symmetrical Triangle pattern. This pattern signals a further downward trend in case the lower border 0.5959 is breached. Here, a hypothetical profit will equal the width of the available pattern that is -27 pips.
- All
- All
- Bearish Rectangle
- Bearish Symmetrical Triangle
- Bearish Symmetrical Triangle
- Bullish Rectangle
- Double Top
- Double Top
- Triple Bottom
- Triple Bottom
- Triple Top
- Triple Top
- All
- All
- Buy
- Sale
- All
- 1
- 2
- 3
- 4
- 5
बियरिश पताका
was formed on 25.07 at 14:30:08 (UTC+0)
signal strength 2 of 5

बियरिश पताका पैटर्न GBPAUD M15 चार्ट पर बना है। यह मौजूदा ट्रेंड कि संभावित निरंतरता का संकेत देता है। निर्दिष्टीकरण: पैटर्न का नीचल स्तर 2.0468 पर है; फ्लैगपोल की ऊंचाई
M5 और M15 समय सीमा में अधिक फाल्स एंट्री पॉइंट्स हो सकते हैं।
Open chart in a new window
डबल बॉटम
was formed on 25.07 at 14:00:19 (UTC+0)
signal strength 2 of 5

डबल बॉटम पैटर्न NZDUSD M15 पर बना है; ऊपरी सीमा 0.6010 है; निचली सीमा 0.6000 है। पैटर्न की चौड़ाई 11 अंक है। ऊपरी सीमा 0.6010 के टूटने के मामले में
M5 और M15 समय सीमा में अधिक फाल्स एंट्री पॉइंट्स हो सकते हैं।
Open chart in a new window
इन्वर्स हेड एण्ड शोल्डर्स
was formed on 25.07 at 13:55:30 (UTC+0)
signal strength 1 of 5

M5 के चार्ट के अनुसार, AUDCHF से इन्वर्स हेड एण्ड शोल्डर्स पैटर्न बना। हेड का टॉप 0.5232 पर सेट है जबकि नेक की मध्य रेखा 0.5224/0.5229 पर स्थित है। इन्वर्स
M5 और M15 समय सीमा में अधिक फाल्स एंट्री पॉइंट्स हो सकते हैं।
Open chart in a new window