Өзекті паттерндер

Бычий флаг
сформирован 30.04 в 20:31:46 (UTC+0)
сила сигнала 3 из 5
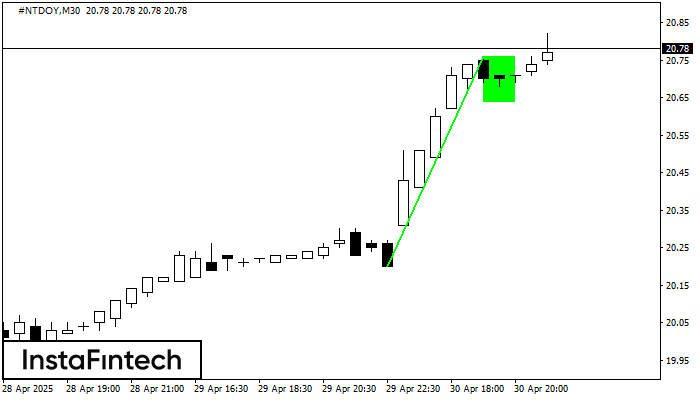
На графике #NTDOY M30 сформировалась фигура «Бычий флаг», которая сигнализирует о продолжении восходящего тренда. Сигналы: Пробой максимума фигуры 20.76 может привести к продолжению восходящего движения, где рост инструмента будет являться проекцией высоты флагштока.
Сондай-ақ қараңыз
- Все
- Все
- Bearish Rectangle
- Bearish Symmetrical Triangle
- Bearish Symmetrical Triangle
- Bullish Rectangle
- Double Top
- Double Top
- Triple Bottom
- Triple Bottom
- Triple Top
- Triple Top
- Все
- Все
- Покупка
- Продажа
- Все
- 1
- 2
- 3
- 4
- 5
Triple Bottom
сформирован 23.06 в 23:01:04 (UTC+0)
сила сигнала 2 из 5
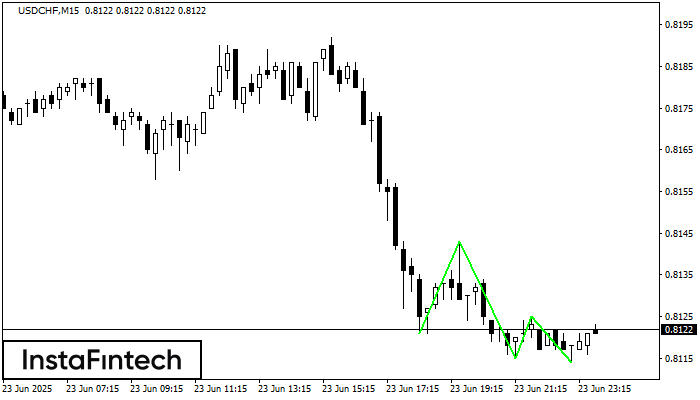
The Triple Bottom pattern has formed on the chart of the USDCHF M15 trading instrument. The pattern signals a change in the trend from downwards to upwards in the case
The M5 and M15 time frames may have more false entry points.
Открыть график инструмента в новом окне
Bullish Rectangle
сформирован 23.06 в 21:35:15 (UTC+0)
сила сигнала 1 из 5
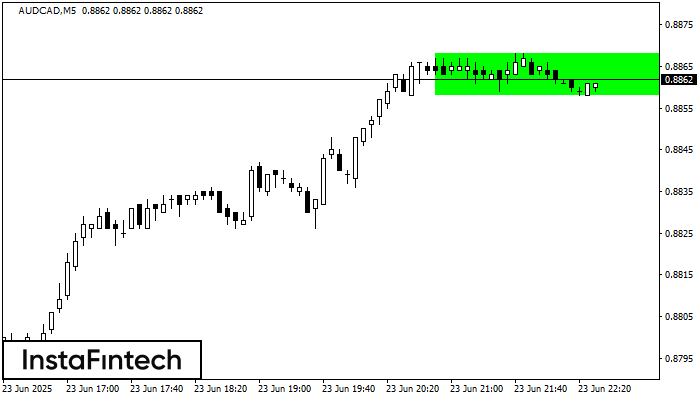
According to the chart of M5, AUDCAD formed the Bullish Rectangle which is a pattern of a trend continuation. The pattern is contained within the following borders: the lower border
The M5 and M15 time frames may have more false entry points.
Открыть график инструмента в новом окне
Double Top
сформирован 23.06 в 21:30:16 (UTC+0)
сила сигнала 2 из 5
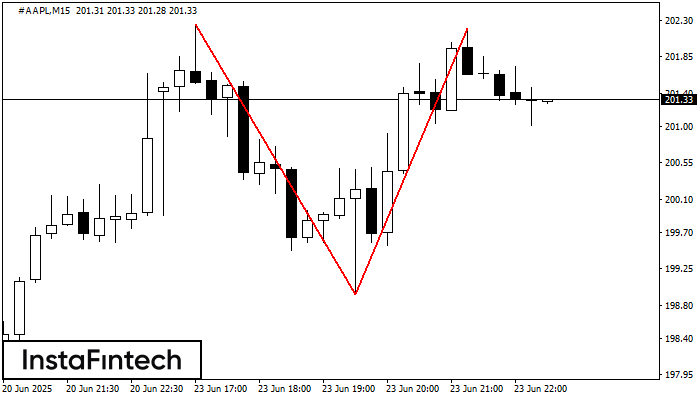
The Double Top reversal pattern has been formed on #AAPL M15. Characteristics: the upper boundary 202.25; the lower boundary 198.94; the width of the pattern is 326 points. Sell trades
The M5 and M15 time frames may have more false entry points.
Открыть график инструмента в новом окне