Өзекті паттерндер

Двойная вершина
сформирован 20.06 в 14:59:51 (UTC+0)
сила сигнала 4 из 5
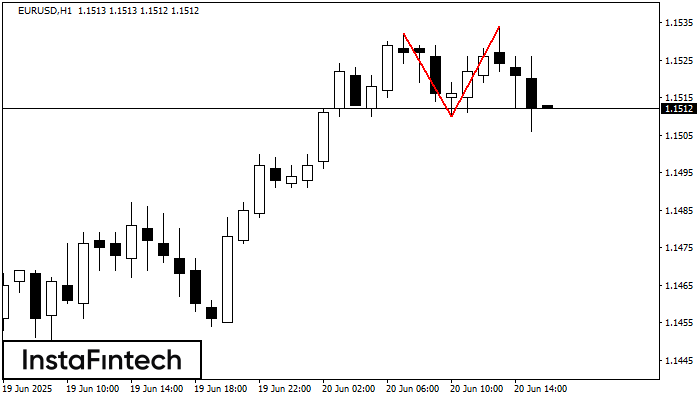
По торговому инструменту EURUSD на H1 сформировалась фигура «Двойная вершина», которая сигнализирует нам об изменении тенденции с восходящей на нисходящую. Вероятно, что, в случае пробоя основания фигуры 1.1510, возможно дальнейшее нисходящее движение.
- Все
- Все
- Bearish Rectangle
- Bearish Symmetrical Triangle
- Bearish Symmetrical Triangle
- Bullish Rectangle
- Double Top
- Double Top
- Triple Bottom
- Triple Bottom
- Triple Top
- Triple Top
- Все
- Все
- Покупка
- Продажа
- Все
- 1
- 2
- 3
- 4
- 5
Triple Top
сформирован 31.07 в 23:46:32 (UTC+0)
сила сигнала 2 из 5
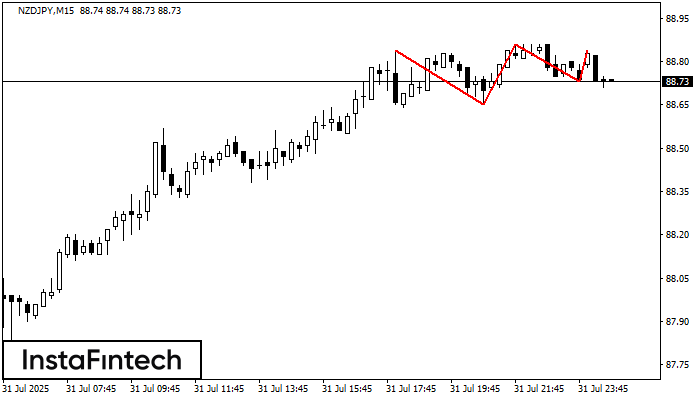
The Triple Top pattern has formed on the chart of the NZDJPY M15. Features of the pattern: borders have an ascending angle; the lower line of the pattern
The M5 and M15 time frames may have more false entry points.
Открыть график инструмента в новом окне
Bearish Rectangle
сформирован 31.07 в 23:42:40 (UTC+0)
сила сигнала 2 из 5
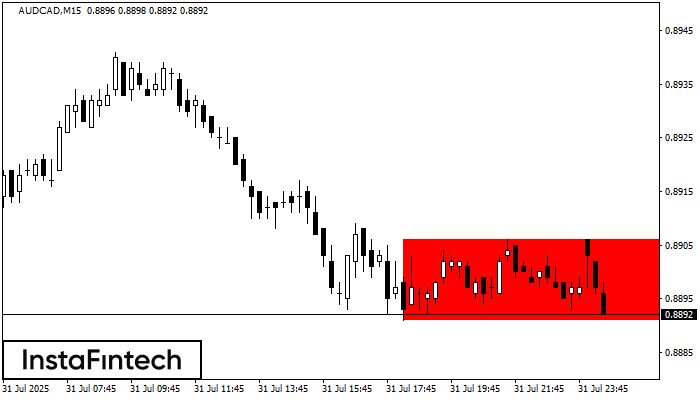
According to the chart of M15, AUDCAD formed the Bearish Rectangle. The pattern indicates a trend continuation. The upper border is 0.8906, the lower border is 0.8891. The signal means
The M5 and M15 time frames may have more false entry points.
Открыть график инструмента в новом окне
Double Bottom
сформирован 31.07 в 23:00:29 (UTC+0)
сила сигнала 2 из 5
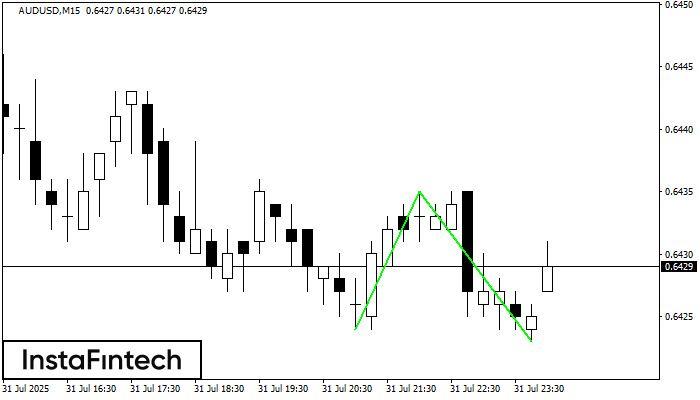
The Double Bottom pattern has been formed on AUDUSD M15. Characteristics: the support level 0.6424; the resistance level 0.6435; the width of the pattern 11 points. If the resistance level
The M5 and M15 time frames may have more false entry points.
Открыть график инструмента в новом окне