Lihat juga

 05.05.2025 05:52 PM
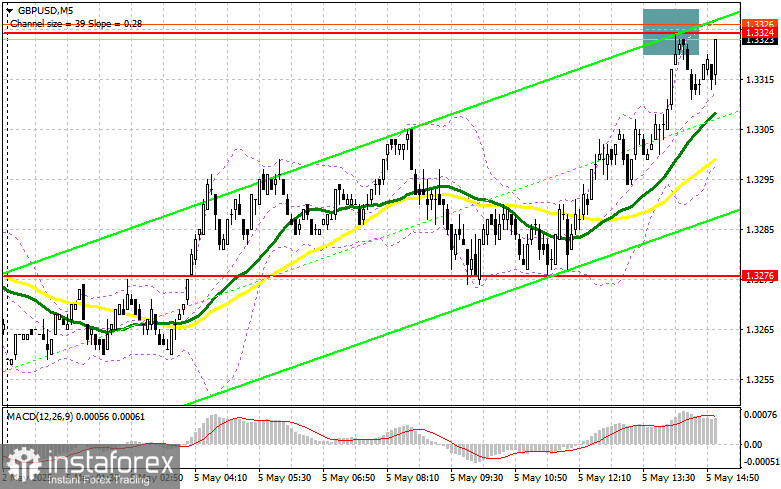
In my morning forecast, I focused on the 1.3324 level and planned to make trading decisions based on it. Let's look at the 5-minute chart and analyze what happened. A rise and false breakout around 1.3324 created a good entry point for short positions, but a significant decline in the pair did not follow. The technical outlook was revised for the second half of the day.
To open long positions on GBP/USD:
Upcoming data on the ISM Services PMI and the Composite PMI, which includes the manufacturing sector, could be problematic for dollar buyers if weak. This would trigger a new wave of growth for GBP/USD. Otherwise, pressure on the pair will return, and I plan to take advantage of that. If the market reacts bearishly to the data, I expect buyers to show interest around the new support at 1.3309, formed in the first half of the day. A false breakout there would provide a good entry point for long positions aiming for a recovery toward the resistance at 1.3341. A breakout and retest from top to bottom of this range would lead to a new long entry point with the prospect of a move toward 1.3371, restoring the bullish market. The most distant target would be the 1.3403 area, where I plan to take profit. If GBP/USD falls and there's no bullish activity at 1.3309 in the second half of the day, pressure on the pound will return. In this case, only a false breakout near 1.3276 would be a valid signal for opening long positions. I plan to buy GBP/USD on a rebound from 1.3240 with a target of a 30–35 point intraday correction.
To open short positions on GBP/USD:
Sellers showed up but not convincingly enough, so we didn't see a drop in the pound during the first half of the day. If GBP/USD makes another upward move after weak U.S. data, I plan to act only if there's a false breakout at the 1.3341 resistance level, as described above. This would offer a selling opportunity aimed at pushing the pound down toward the 1.3276 support, where the moving averages favor bulls. A breakout and upward retest of this range would trigger stop-loss orders, opening the path to 1.3240 — the new weekly low. The furthest target would be the 1.3205 area, where I plan to take profit. If demand for the pound persists in the second half of the day and bears don't show up around 1.3341, it's better to delay selling until testing the 1.3371 resistance. I will only open short positions there on a false breakout. If there's no downward movement from there either, I'll look for short positions on a rebound from 1.3403, aiming for a 30–35 point downward correction.
Indicator signals:
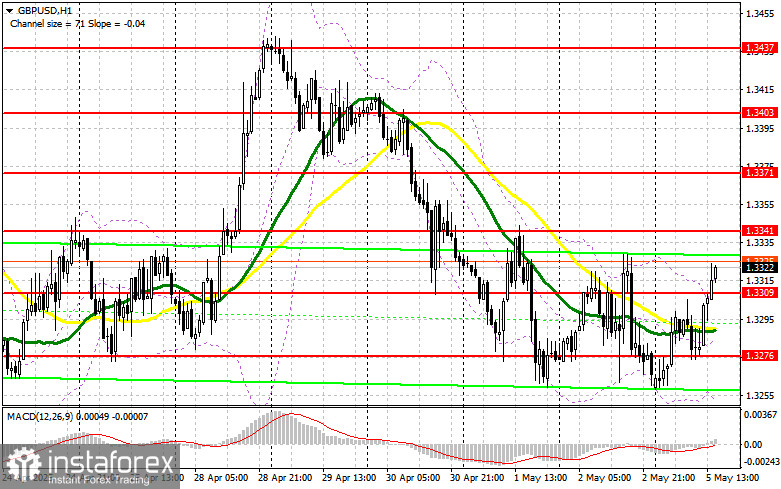
Moving Averages: Trading is taking place above the 30- and 50-day moving averages, indicating further potential for pound growth.
Note: The author analyzes the moving averages on the hourly (H1) chart, which differs from the standard definition of daily moving averages on the daily (D1) chart.
Bollinger Bands: In the event of a decline, the lower boundary of the indicator around 1.3285 will serve as support.
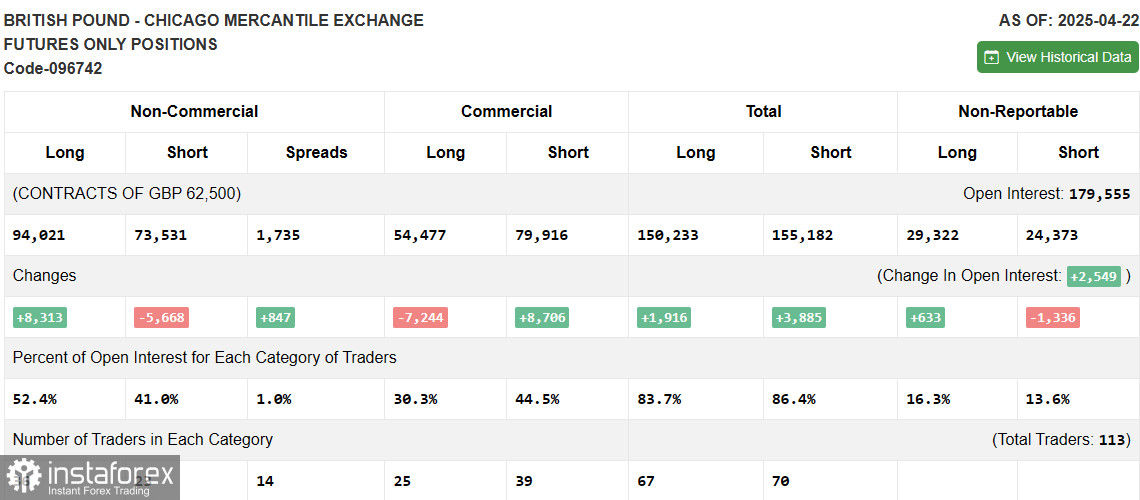
Indicator descriptions: • Moving Average – determines the current trend by smoothing out volatility and noise. Period – 50 (yellow on the chart) • Moving Average – determines the current trend by smoothing out volatility and noise. Period – 30 (green on the chart) • MACD (Moving Average Convergence/Divergence) – Fast EMA: period 12; Slow EMA: period 26; SMA: period 9 • Bollinger Bands – period 20 • Non-commercial traders – speculators such as individual traders, hedge funds, and large institutions that use the futures market for speculative purposes and meet specific requirements • Long non-commercial positions – the total long open positions of non-commercial traders • Short non-commercial positions – the total short open positions of non-commercial traders • Net non-commercial position – the difference between short and long positions of non-commercial traders.


