Lihat juga

 09.09.2025 12:30 PM
Trade review and tips for trading the Japanese yen
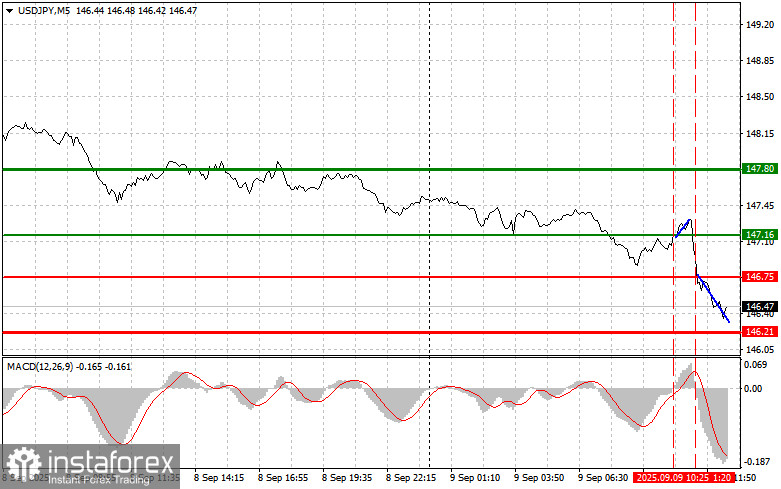
The price test of 147.16 occurred when the MACD indicator had just begun moving upward from the zero mark, which gave a chance for an upward correction of the pair. However, a significant rally did not follow. Then came the price test of 146.75, which coincided with the MACD indicator beginning to move downward from the zero mark. This confirmed the correct entry point for selling the dollar, resulting in the pair falling by 30 points.
During the U.S. session, the NFIB Small Business Optimism Index report is expected. Only after strong data might the yen weaken slightly against the dollar. Otherwise, the bearish trend in USD/JPY will persist. While this indicator is not a decisive factor for long-term trends, it can trigger short-term fluctuations in the currency market, especially if the actual value significantly exceeds expectations. However, investor focus remains primarily on Bank of Japan policy and the prospects of changes in its monetary policy. Any signals of a possible policy shift—whether in official statements or macroeconomic forecasts—can have a far greater impact on the yen.
As for intraday strategy, I will rely more on implementing Scenarios #1 and #2.
Buy Signal
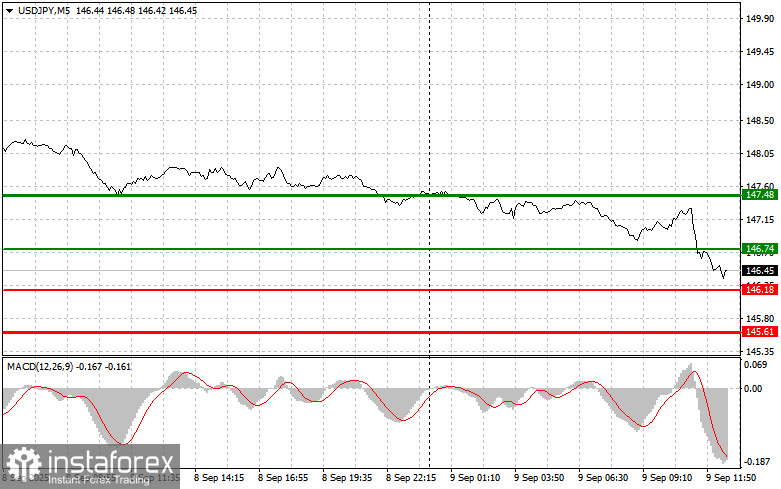
Scenario #1: I plan to buy USD/JPY today on a move toward 146.74 (green line on the chart) with a target of 147.48 (thicker green line on the chart). Around 147.48, I will exit purchases and open sales in the opposite direction, targeting a 30–35 point move back from the level. A rise in the pair is only possible after strong data. Important! Before buying, make sure the MACD indicator is above the zero mark and just beginning to rise from it.
Scenario #2: I also plan to buy USD/JPY if the price tests 146.18 twice in a row while the MACD indicator is in the oversold area. This will limit the pair's downward potential and trigger a reversal upward. Growth can be expected toward the opposite levels of 146.74 and 147.48.
Sell Signal
Scenario #1: I plan to sell USD/JPY today after a breakout of 146.18 (red line on the chart), which will lead to a quick decline in the pair. The key target for sellers will be 145.61, where I will exit sales and immediately open purchases in the opposite direction, targeting a 20–25 point move back from the level. Pressure on the pair will return if the data is weak. Important! Before selling, make sure the MACD indicator is below the zero mark and just beginning to move down from it.
Scenario #2: I also plan to sell USD/JPY if the price tests 146.74 twice in a row while the MACD indicator is in the overbought area. This will limit the pair's upward potential and lead to a reversal downward. A decline can be expected toward the opposite levels of 146.18 and 145.61.
What's on the chart:
Important: Beginner Forex traders must be very cautious when deciding to enter the market. Before the release of major fundamental reports, it is best to stay out of the market to avoid sharp fluctuations. If you decide to trade during news releases, always place stop orders to minimize losses. Without stop orders, you can quickly lose your entire deposit, especially if you do not use money management and trade large volumes.
And remember: for successful trading, you must have a clear trading plan, like the one I presented above. Spontaneous decision-making based on the current market situation is an inherently losing strategy for intraday traders.


