Lihat juga

 15.09.2025 04:31 AM
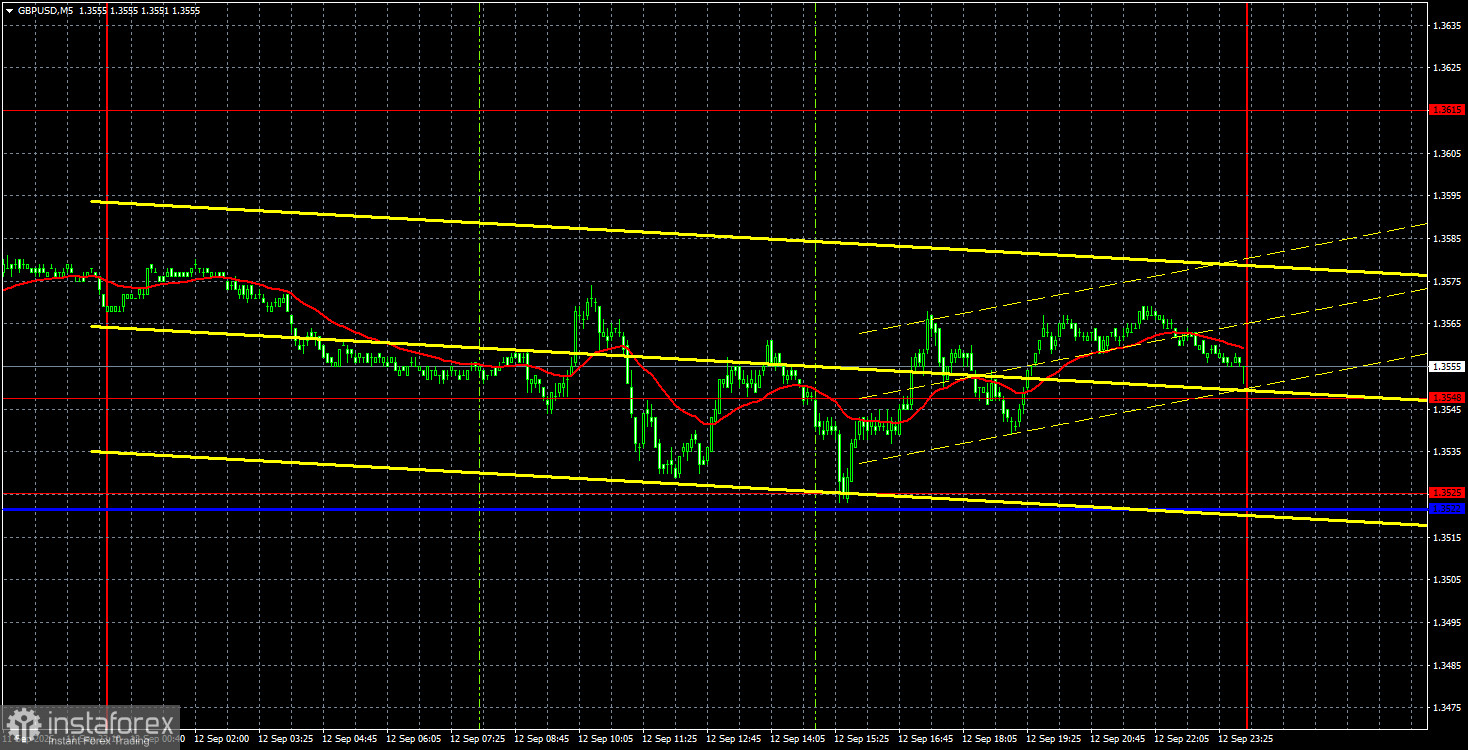
On Friday, the GBP/USD pair also traded sideways with low volatility. In the UK, GDP and industrial production reports came out that day, but they didn't particularly interest the market. At best, the reaction was around 20 pips. So, technically, nothing changed on the hourly timeframe.
Next week, at least two events could seriously shake the market. It's obvious the Bank of England will take a pause and keep the key rate unchanged. It's also clear that the Federal Reserve will cut the key rate by 0.25%. However, the Fed could guide the market on how many more cuts to expect for the rest of the year. Currently, one more rate cut is expected in the last two meetings. The more dovish the signals from the Fed, the bigger the potential dollar drop. The dollar may fall even without overtly "dovish" messaging from the Fed because policy is already shifting towards easing, while the BoE stands pat. The uptrend continues, as shown by the trendline. A move below the trendline shouldn't be a shock—it would still be just a correction.
On the 5M chart, Friday's moves are hardly worth analyzing, as the entire day was flat. The 1.3525–1.3548 support zone held, but traders showed no desire to push lower. Although several buy signals formed formally, the price overall moved sideways.
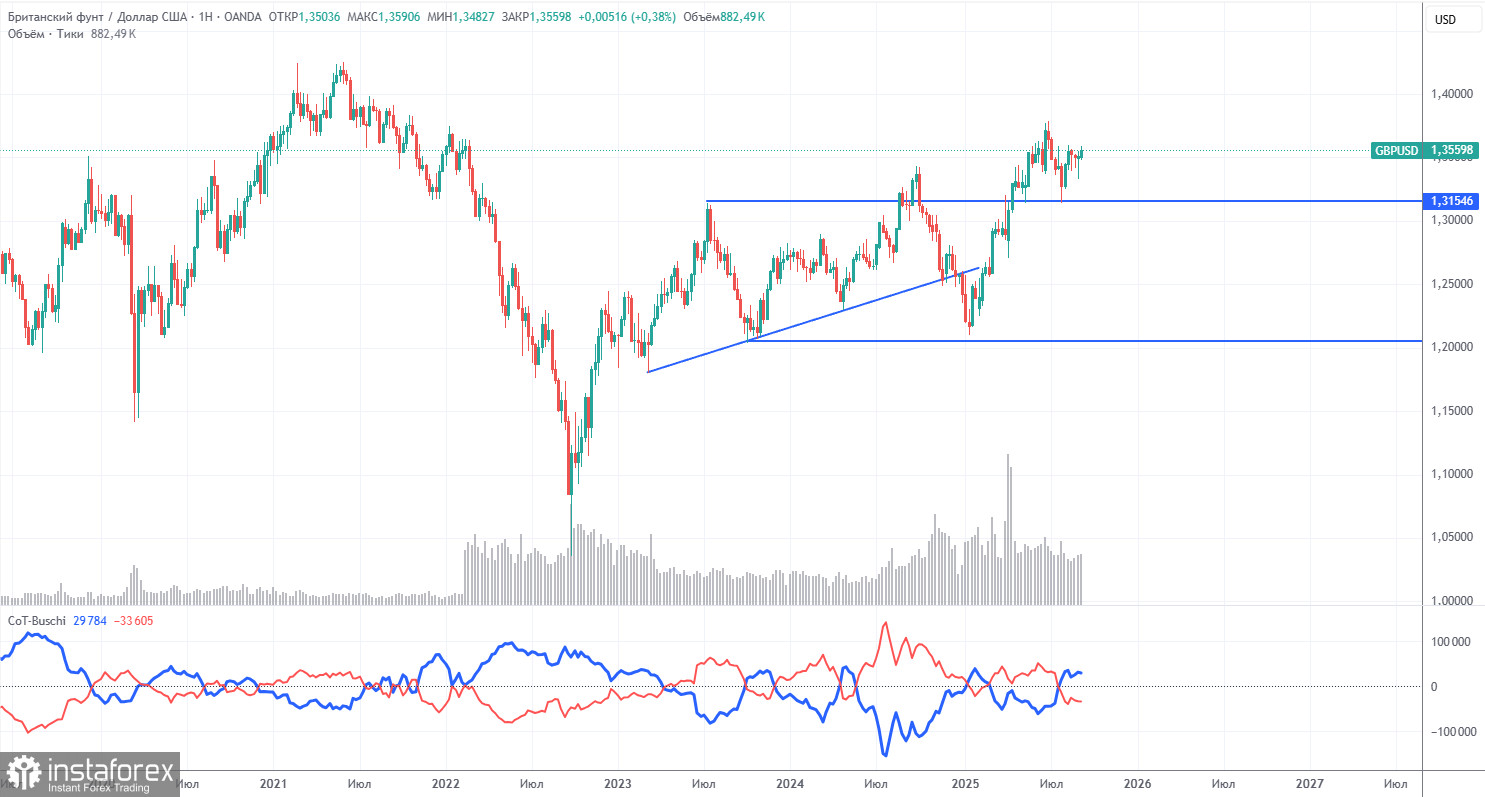
COT reports on the British pound show that commercial traders' sentiment has been constantly changing in recent years. The red and blue lines (net positions of commercial and non-commercial traders) cross frequently and generally stay near zero. Right now, they're almost at the same level, which signals roughly equal amounts of long and short positions.
The dollar is still falling due to Trump's policies, so market maker demand for the pound is not so important right now. The trade war will continue, one way or another, for a long time. The Fed will lower rates at least once more within the next year, so dollar demand will keep falling. The latest COT report shows "Non-commercial" closed 1,200 BUY contracts and 700 SELL contracts. So, the net position decreased by 500 contracts during the reporting week.
The pound shot up in 2025, but the cause is clear—Donald Trump's policy. Once that factor is neutralized, the dollar could rally, but no one knows when that will happen. It doesn't really matter whether the net position in the pound rises or falls—the dollar's net position keeps shrinking, usually at a faster pace.
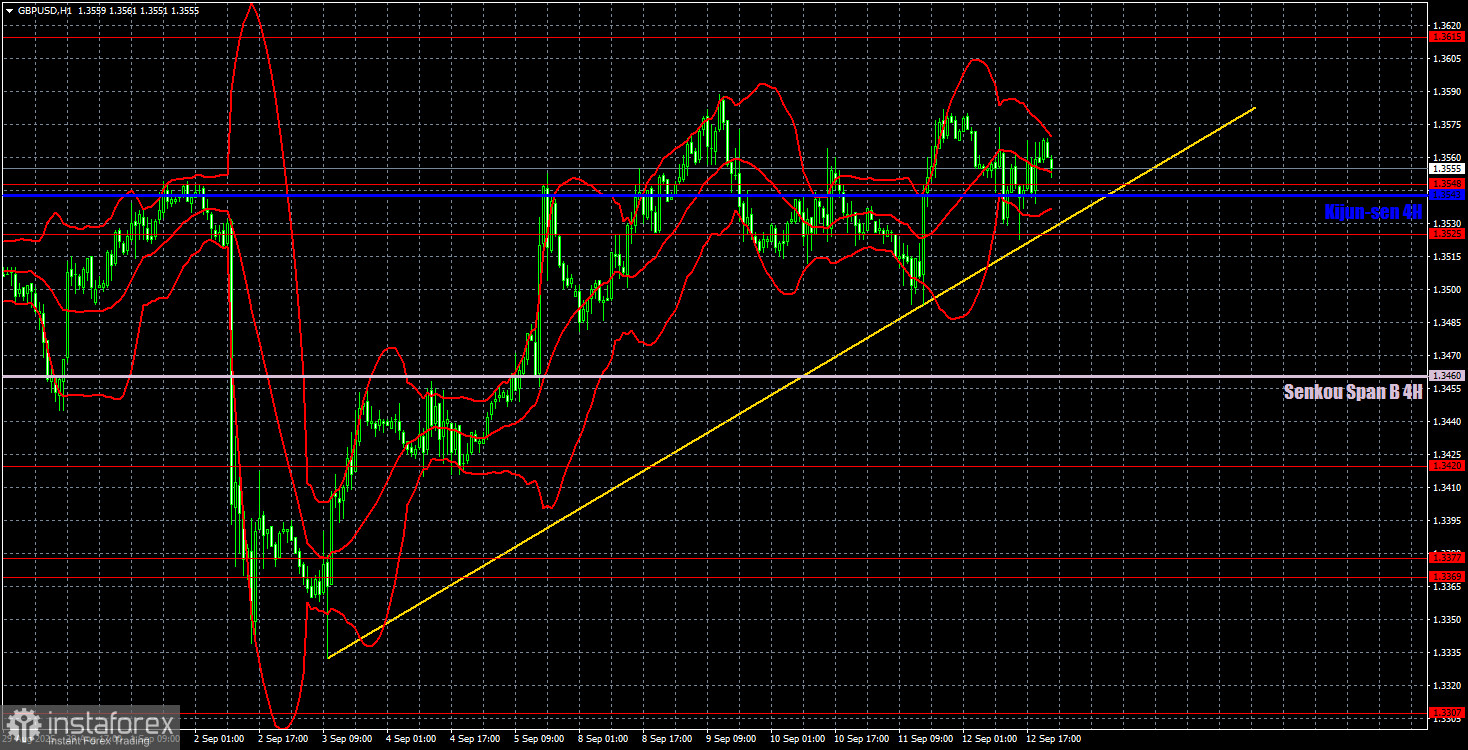
On the hourly chart, GBP/USD is ready to form a new uptrend—that's what it's currently doing. Fundamentals and the macro backdrop are still weak for the dollar, so there's no reason to expect a medium-term dollar rally. A dip is theoretically possible this week, but as things stand, the fundamentals are lined up for more dollar weakness.
September 15 levels: 1,3125, 1,3212, 1,3369–1,3377, 1,3420, 1,3525–1,3548, 1,3615, 1,3681, 1,3763, 1,3833, 1,3886. Senkou Span B (1.3460) and Kijun-sen (1.3543) can also be signal sources. Set your Stop Loss to break even if the price goes 20 pips in your favor. Ichimoku lines can shift during the day, so allow for that with signals.
On Monday, neither the US nor the UK has key reports or events scheduled. So Friday's flat trading could quietly carry over into Monday with the same slow volatility and low trading enthusiasm.
We believe Monday's rally may continue, as almost all factors point to it right now. The target is 1.3615. We expect the pound's rally to persist above that level as well. Volatility may remain low.


