Lihat juga

 15.09.2025 05:21 AM
On the weekly chart, the price has reached the upper boundary of the descending price channel. From here, there are two options: either a breakout upward from the current levels with the possibility of medium-term growth, or a reversal downward from the current levels for a medium-term decline.
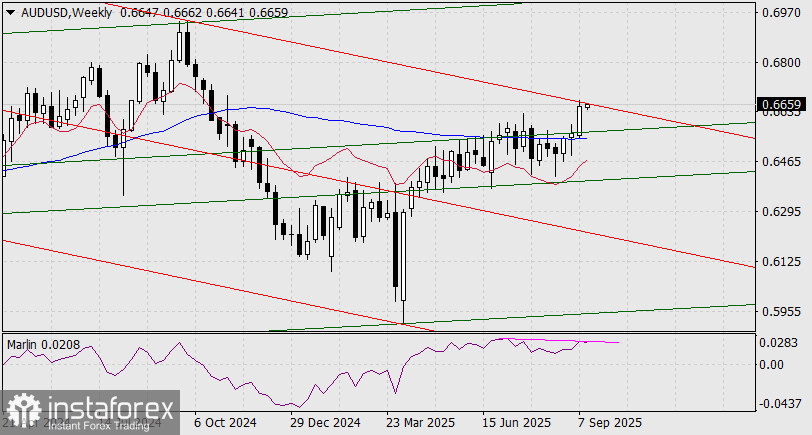
A divergence between the price and the Marlin oscillator suggests a higher probability of the downside scenario.
On the daily chart, consolidation below the July peak (0.6627) will be the first signal of a reversal.
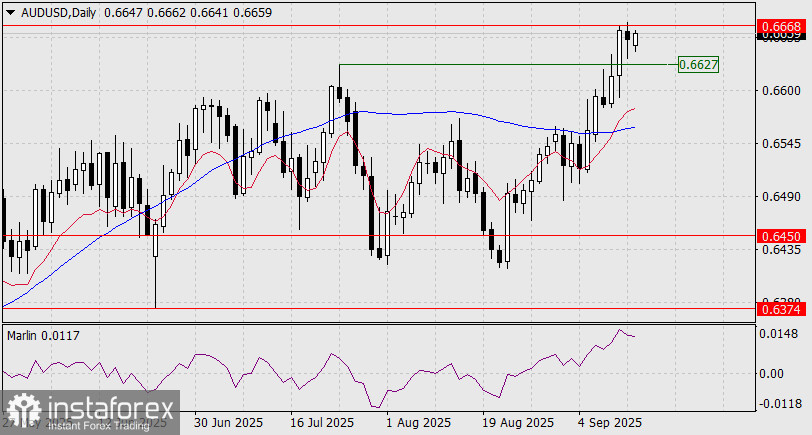
The Marlin oscillator is already indicating further downside. A break above 0.6668 opens the way to growth (alternative scenario).
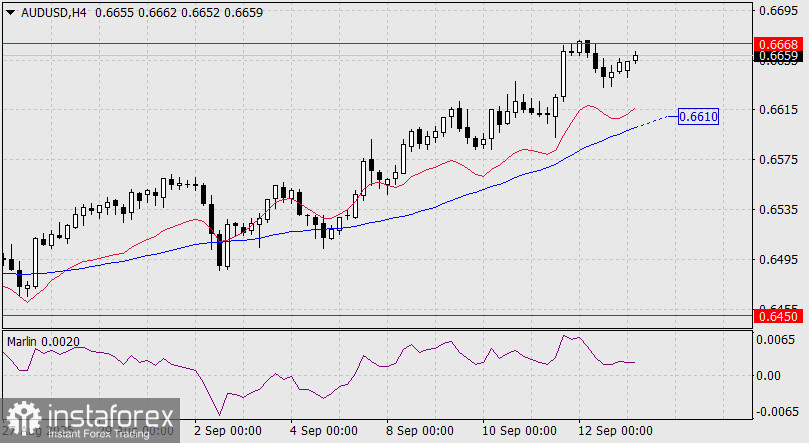
Consolidation below the MACD line on the four-hour chart (0.6610) will be a confirming signal of a price reversal.
The main driver for growth or decline will be the Fed's decision on monetary policy on September 17. We are waiting.
You have already liked this post today
* Analisis pasaran yang disiarkan di sini adalah bertujuan untuk meningkatkan kesedaran anda, tetapi tidak untuk memberi arahan untuk membuat perdagangan.


