Lihat juga

 16.09.2025 10:14 AM
Trend analysis (Fig. 1).
On Tuesday, the market from the level of 1.1760 (closing of yesterday's daily candle) may continue upward movement with the target at 1.1788 – the upper fractal (yellow dotted line). When testing this level, the price may pull back downward to test the upper fractal at 1.1774 (daily candle from 15.09.2025).
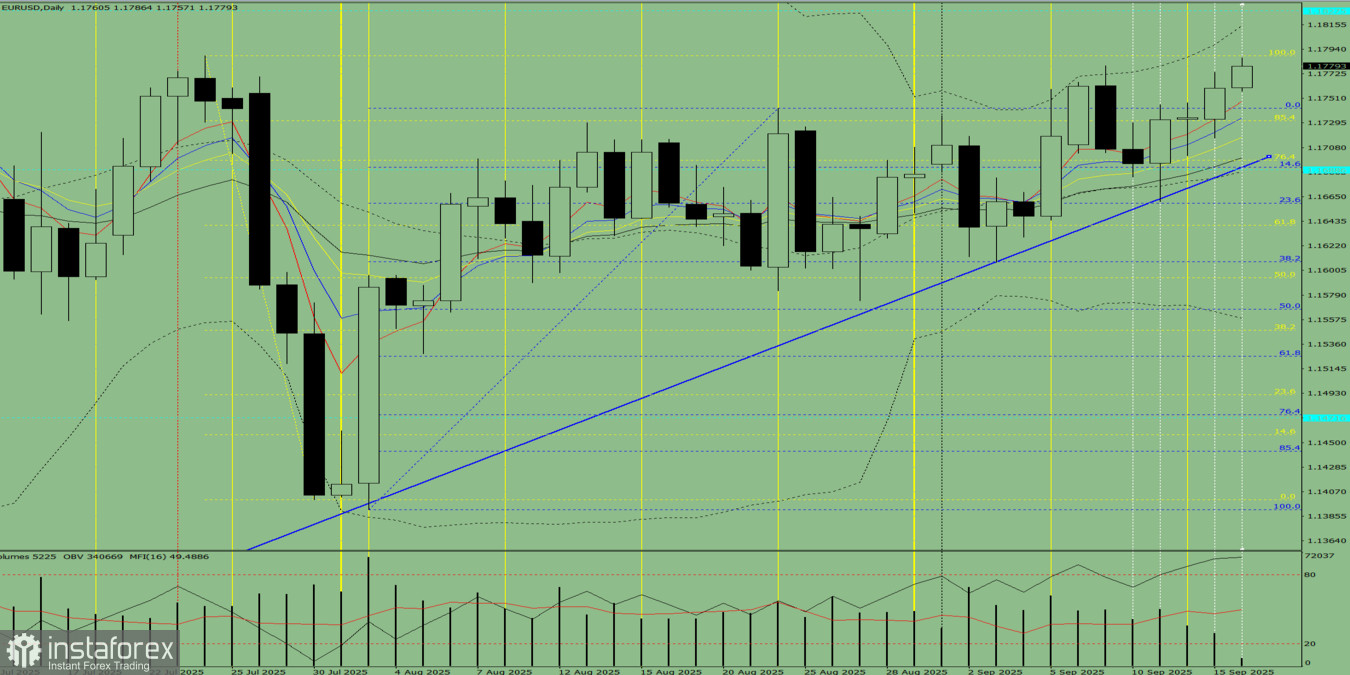
Fig. 1 (daily chart).
Comprehensive analysis:
Overall conclusion: upward trend.
Alternative scenario: from the level of 1.1760 (closing of yesterday's daily candle), the price may continue moving upward with the target at 1.1829 – historical resistance level (blue dotted line). When testing this level, the price may pull back downward to test the upper fractal at 1.1788 (yellow dotted line).
You have already liked this post today
* Analisis pasaran yang disiarkan di sini adalah bertujuan untuk meningkatkan kesedaran anda, tetapi tidak untuk memberi arahan untuk membuat perdagangan.


