Lihat juga

 22.09.2025 06:01 PM
EUR/USD
Brief Analysis:
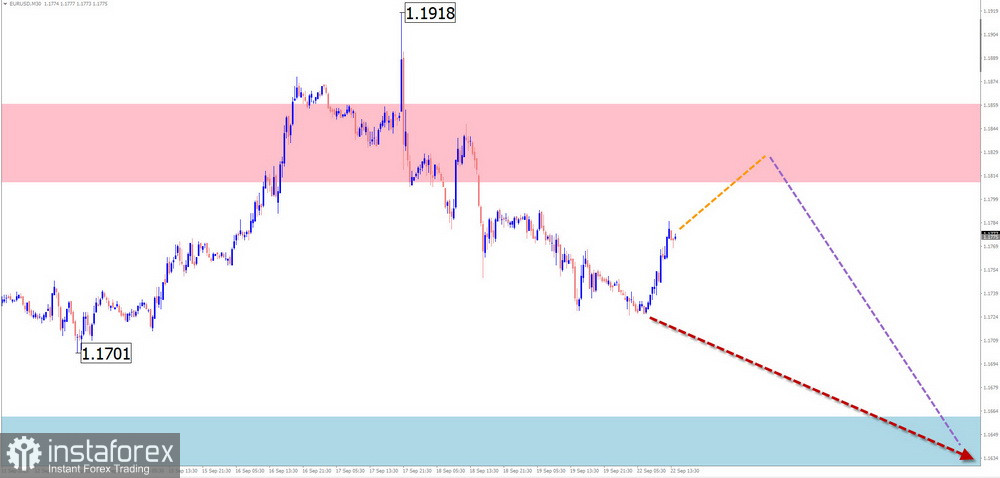
The upward wave algorithm that began on July 31 continues to push the euro's main pair quotes toward the upper part of the chart. Since late August, the price has been forming a sideways corrective segment (B), which was still incomplete at the time of analysis. A week ago, the price entered a strong potential reversal zone and began pulling back, forming the final part (C) of the correction.
Forecast for the Week:
A bullish price vector is expected over the next few days, leading the euro toward calculated resistance levels. A reversal within this zone and a return to a bearish trend are likely by the weekend. The projected support/resistance zones define the expected weekly trading range.
Potential Reversal Zones
Resistance:
Support:
Recommendations:
Buying: Can be used intraday with reduced volume size. Upward potential is limited by resistance.
Selling: Premature until clear reversal signals appear near resistance.
USD/JPY
Brief Analysis:
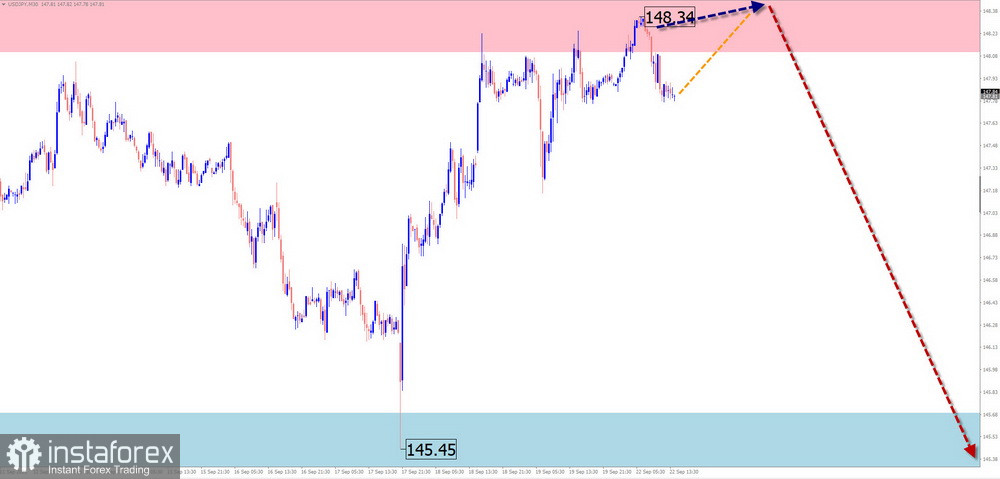
On the USD/JPY chart, a bearish wave structure opposing the previous bullish trend has been forming since August 1. This structure is at a high wave level, and its middle segment (B) in a sideways range is nearing completion. The price has created a horizontal channel around a few figures wide.
Forecast for the Week:
Continued sideways drift along the resistance boundaries is the most likely scenario in the coming days. There's a possibility of pressure on the upper boundary, potentially with a brief breakout. Toward the weekend, increased volatility and a downward price movement can be expected. The release of significant economic data may serve as a key turning point.
Potential Reversal Zones
Resistance:
Support:
Recommendations:
Buying: Risky due to low upward potential and may result in losses.
Selling: Can be a primary trade direction once reversal signals appear near resistance in your trading system.
GBP/JPY
Brief Analysis:
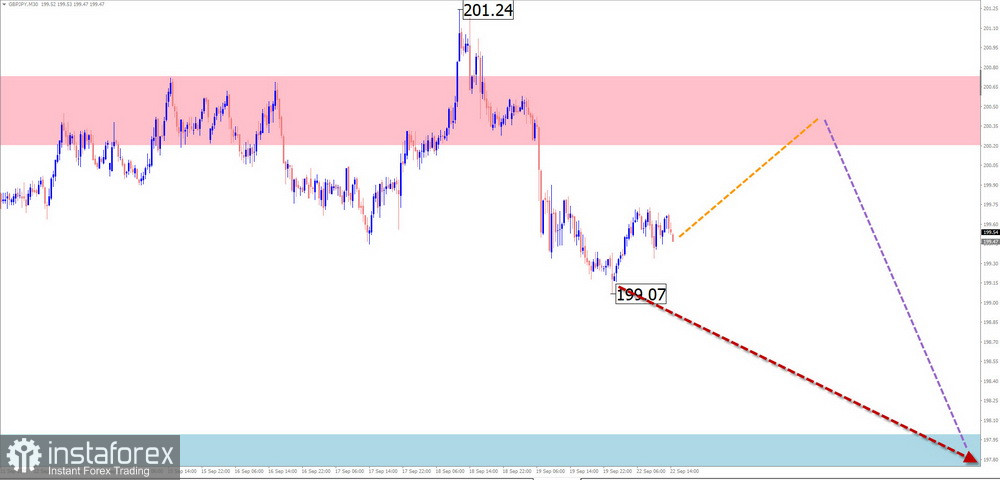
The upward wave that started in August continues to dominate the pound/yen pair chart. Quotes have reached the lower boundary of a broad potential reversal zone on the higher timeframe. Since September 18, price movement has begun downward with reversal potential. The current structure still appears incomplete.
Forecast for the Week:
Predominantly sideways movement is expected. Early in the week, an upward-biased range may develop toward resistance. In the latter half, expect the sideways period to end and the downward trend to resume. Rising volatility may coincide with key economic data releases.
Potential Reversal Zones
Resistance:
Support:
Recommendations:
Buying: Limited potential and high risk.
Selling: May be used once confirmed reversal signals near resistance appear.
USD/CAD
Brief Analysis:
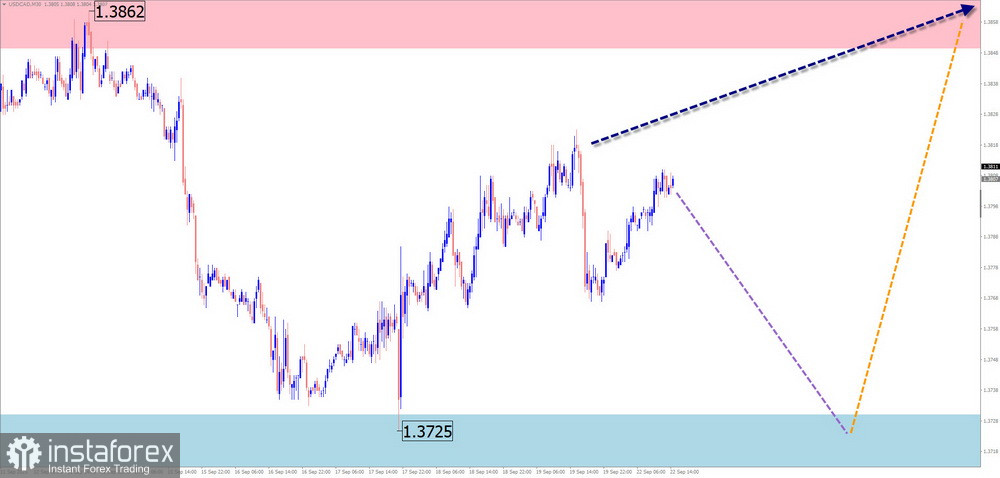
The trend direction for the USD/CAD pair is driven by a downward wave that began at the start of the year. Since April, the pair entered a sideways correction. Extremes on the chart suggest a contracting structure, which remains incomplete. Price is moving within a horizontal channel.
Forecast for the Week:
A sideways to slightly bearish movement is likely in the coming days. Price is expected to approach support, followed by a potential reversal and resumption of the upward trend. The calculated resistance level marks the estimated upper boundary of this week's range.
Potential Reversal Zones
Resistance:
Support:
Recommendations:
Selling: May be initiated with small volumes but offers low potential.
Buying: Can be profitable after confirmed reversal signals appear near support. Keep in mind the limited upward potential.
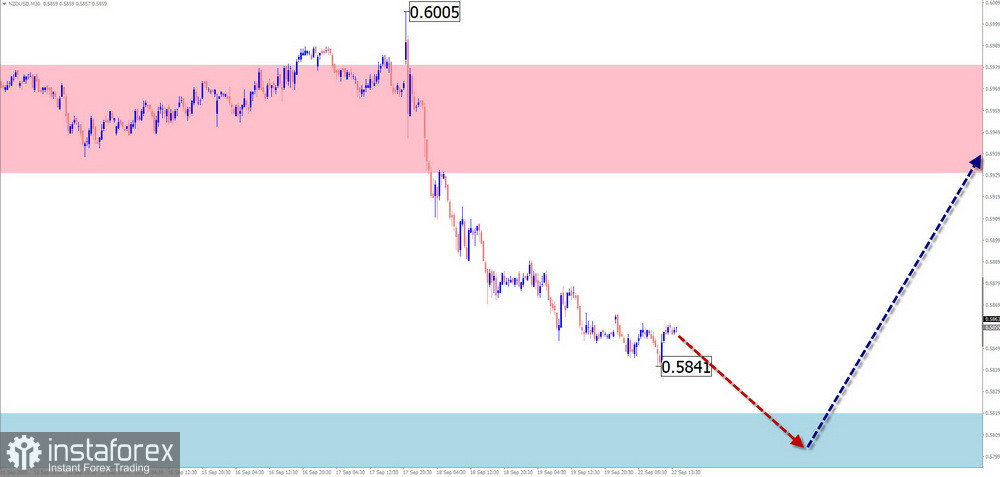
NZD/USD
Brief Analysis:
The current wave structure on the NZD/USD chart is bullish and began in early April. Since July, a correctional flat wave has been unfolding and remains incomplete. The tentative target zone for the correction coincides with the upper boundary of a strong potential reversal area on the higher timeframe.
Forecast for the Week:
Sideways movement with a bearish tilt is likely in the coming days. Price movement is expected to stay within support zone boundaries. By the end of the week, a reversal may form, signaling the resumption of bullish momentum. The projected resistance zone marks the top of the weekly range.
Potential Reversal Zones
Resistance:
Support:
Recommendations:
Selling: May be done with small volumes in individual sessions but offers limited potential.
Buying: Not relevant until confirmed reversal signals near support appear within your strategy.
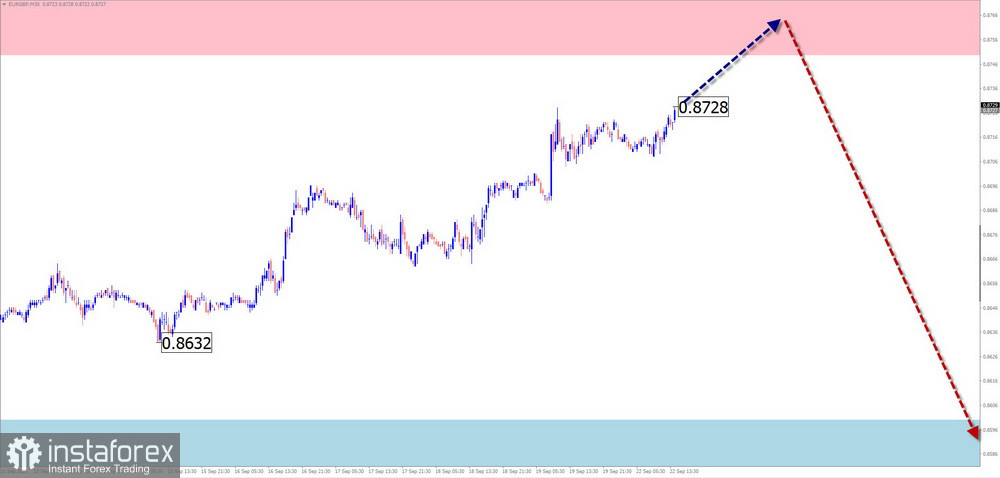
EUR/GBP
Brief Analysis:
Price direction in the EUR/GBP pair has been driven by a downward wave since April. The formation takes the shape of a narrowing flat. The current wave segment (B) remains unfinished. Over the past two months, prices have hovered near the lower boundary of a broad potential reversal zone on the daily timeframe.
Forecast for the Week:
Early in the week, expect sideways movement. A temporary test of the upper resistance zone is possible. Toward the weekend, the probability of a reversal and downward resumption increases. A breakout outside the calculated zones is unlikely.
Potential Reversal Zones
Resistance:
Support:
Recommendations:
Buying: May be done briefly in individual sessions.
Selling: Can be used in trades after confirming signals appear near projected resistance.
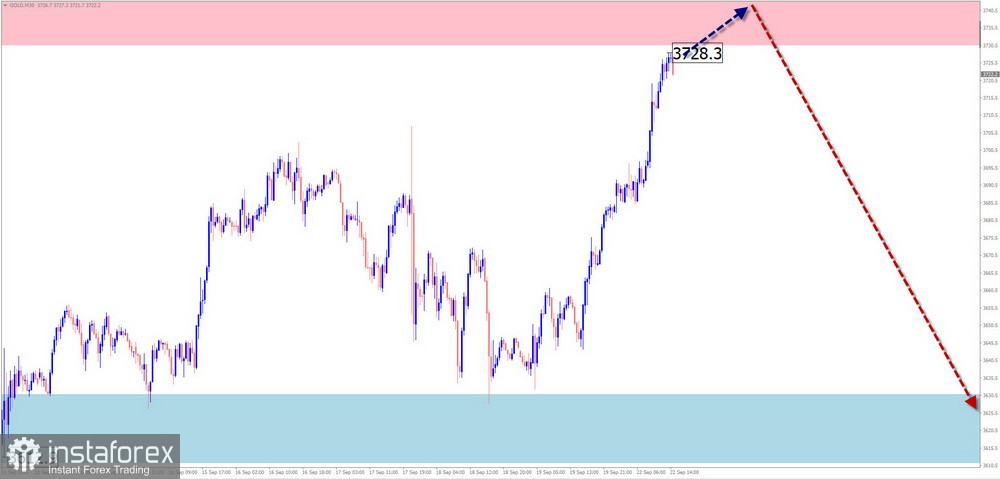
Gold
Analysis:
Gold continues its bullish wave that began in October of last year. On the daily timeframe, this wave is forming the final trend. The wave structure takes the form of a narrowing flat.
Forecast:
Early in the week, expect a short-term price rise toward the resistance zone. After that, prices are expected to move sideways, forming setup conditions for a reversal and the start of a downward move.
Potential Reversal Zones
Resistance:
Support:
Recommendations:
Buying: Limited potential and high risk.
Selling: Becomes relevant after confirmed reversal signals appear near resistance.
Explanations:
In simplified wave analysis (SWA), all waves consist of 3 parts (A-B-C). Only the last incomplete wave is analyzed on each timeframe. Expected movements are shown with dashed lines.
Note: This wave-based algorithm does not account for duration of movements over time.


