Lihat juga

 22.09.2025 06:14 PM
GBP/USD
Brief Analysis:
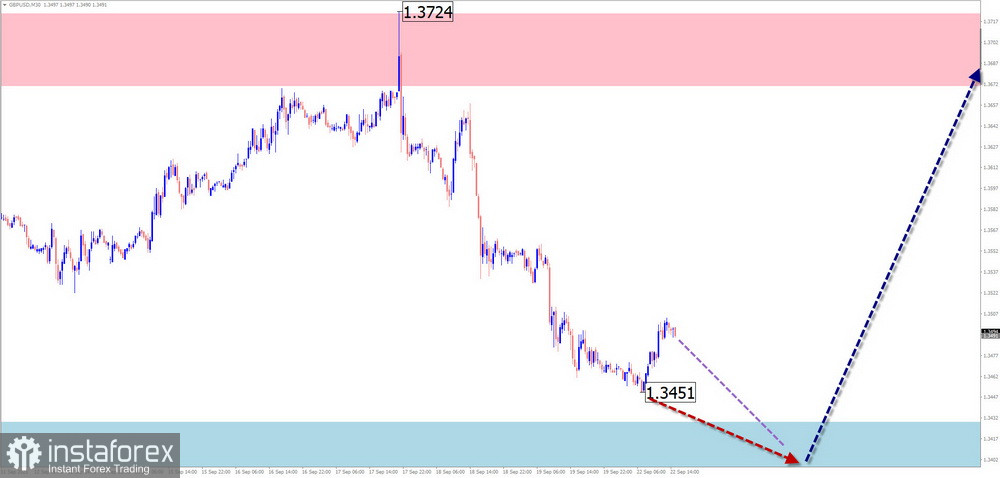
The price trend direction of the British pound has been set by an upward wave since the start of this year. In late June, quotes reached the potential reversal zone on the weekly timeframe. Before further growth, a correction needs to form in the wave structure. As of today, the correction is not yet complete.
Weekly Outlook:
The coming week is expected to bring the end of the pound's downward movement. A temporary decline to the lower boundary is possible early in the week. A trend shift and an upward movement may follow, with resistance aligned at the lower boundary of the weekly reversal zone.
Potential Reversal Zones
Resistance:
Support:
Recommendations
Sells: Risky and may result in losses.
Buys: Upon confirmation signals from your trading system near support, purchases may become the core trade direction.
AUD/USD
Brief Analysis:
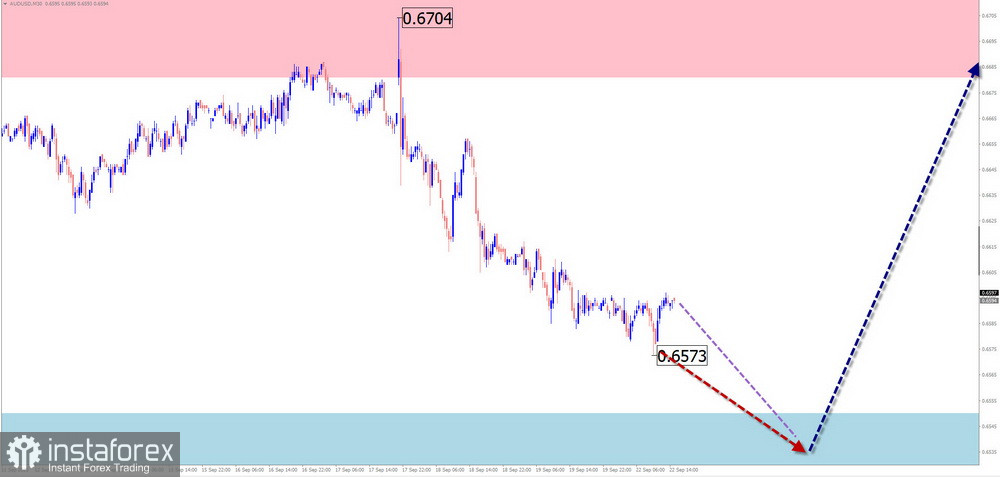
An upward wave zigzag that began in August has brought AUD/USD quotes into a strong potential reversal zone. The wave structure is still incomplete. The current unfinished corrective wave segment began developing on September 11.
Weekly Outlook:
At the start of the week, a bearish vector is more likely, within the context of sideways movement. Toward the weekend, the probability of a reversal and upward movement from resistance increases. The calculated resistance defines the upper limit of the expected weekly range.
Potential Reversal Zones
Resistance:
Support:
Recommendations
Sells: Can be done with reduced position sizes during individual sessions. Downward potential is limited by support.
Buys: Will be relevant after confirmed reversal signals near the support zone.
USD/CHF
Brief Analysis:
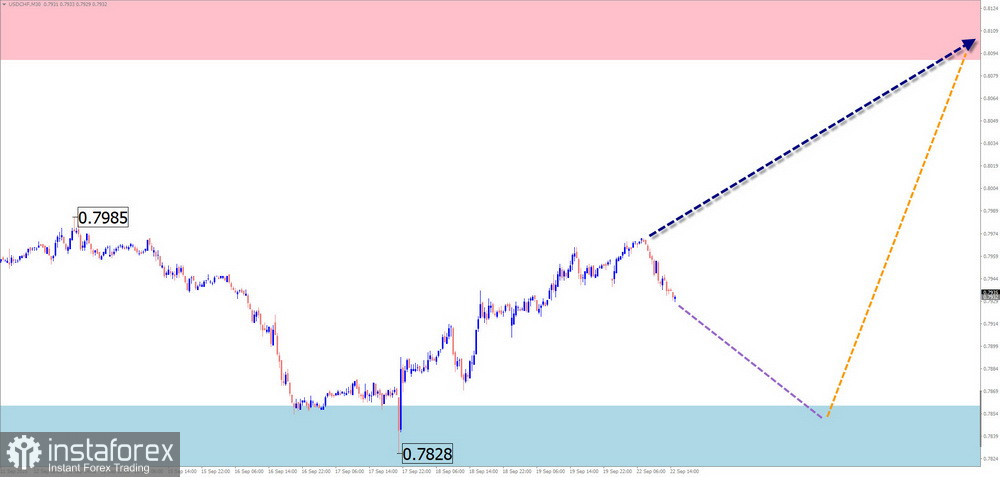
Following the completion of a bearish wave in April, a bullish wave has been forming in the USD/CHF major pair, developing as a narrowing flat. Its strong potential suggests it may continue to evolve on the daily timeframe. Over the last month, quotes have retraced downward, forming the (B) segment of the correction.
Weekly Outlook:
This week is expected to resemble recent periods. After likely moving along support zone boundaries early on, prices may resume rising by the weekend. The projected resistance indicates the maximum price increase potential.
Potential Reversal Zones
Resistance:
Support:
Recommendations
Sells: High-risk and low potential.
Buys: After signals are generated by your trading system near support, purchases can become the main trade direction.
EUR/JPY
Brief Analysis:
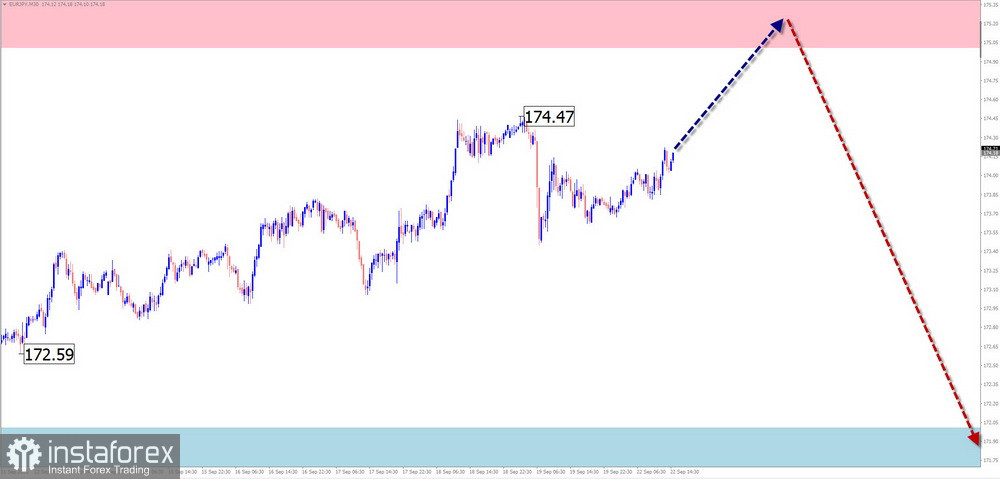
Since February, short-term price direction in the EUR/JPY pair has been governed by an upward wave. Over the past two months, an incomplete corrective phase has been developing in the wave structure. The current upward move is forming the middle part (B) of the correction.
Weekly Outlook:
Sideways movement near resistance is possible in the next few days. Mid-week, expect increased volatility and a likely reversal into a downward move.
Potential Reversal Zones
Resistance:
Support:
Recommendations
Buys: No favorable conditions are present.
Sells: May be used in trading if confirmed entry signals from your system are present.
EUR/CHF
Brief Analysis:
The short-term uptrend in the EUR/CHF pair has been dictated by an upward wave since April. Recently, a corrective flat has been forming within a price channel between 0.94 and 0.92. The structure of this correction remains incomplete.
Weekly Outlook:
The start of the upcoming week is likely to have a bullish bias. There may be pressure on the upper resistance boundary. A reversal and resumption of downward movement is likely closer to the weekend. A breakout below calculated support is unlikely.
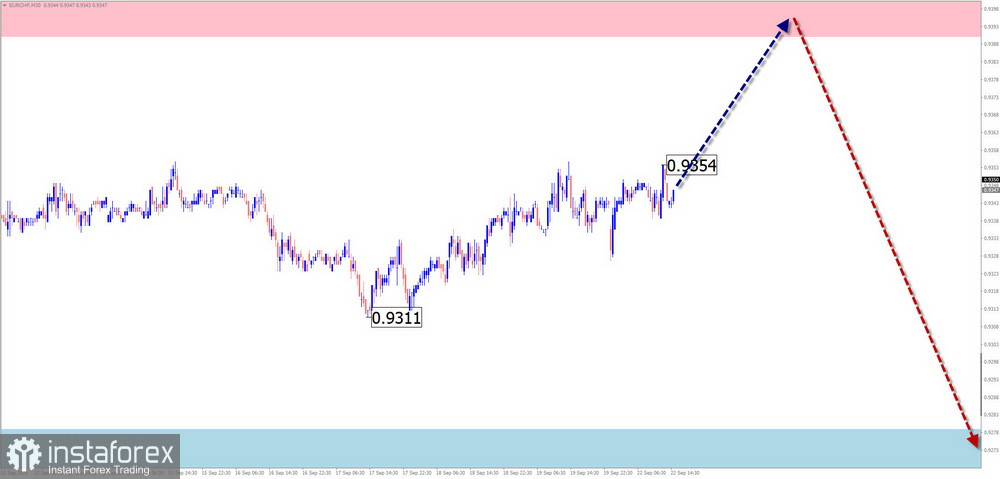
Potential Reversal Zones
Resistance:
Support:
Recommendations
Buys: Possible with reduced volume sizes on an intraday basis.
Sells: Can be used from the resistance area upon confirmation from your trading system.
US Dollar Index
Brief Analysis:
The recent strengthening of the U.S. dollar that began in mid-April is nearing completion. On the daily chart, this period forms a narrowing flat. After reaching the upper boundary of the potential reversal zone, quotes have begun to retreat. Breaking below intermediate support, the index has entered a drifting pattern.
Weekly Outlook:
In the first half of the upcoming week, the index is expected to hover near the resistance boundary. A reversal and downturn are more probable by week's end. The directional shift will likely come with a sharp rise in volatility, potentially triggered by global economic news.
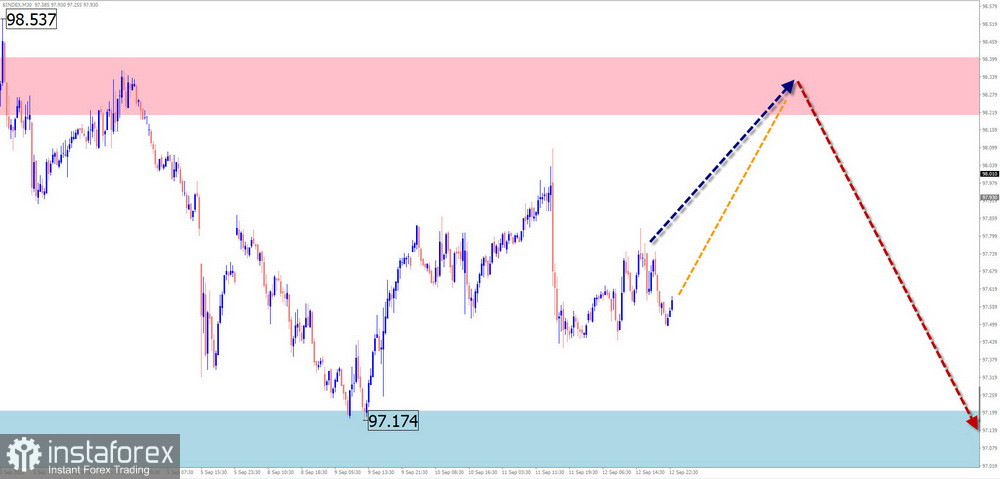
Potential Reversal Zones
Resistance:
Support:
Recommendations
Buying the U.S. Dollar in major pairs has little potential. It is more reasonable to consider bullish positions in major currencies instead.
Explanations:
In Simplified Wave Analysis (SWA), all waves consist of 3 parts (A-B-C). On each timeframe, the last unfinished wave is analyzed. Dotted lines show expected movement.
Note: The wave algorithm does not account for the duration of price movements over time!


