Lihat juga

 02.06.2026 04:26 AM
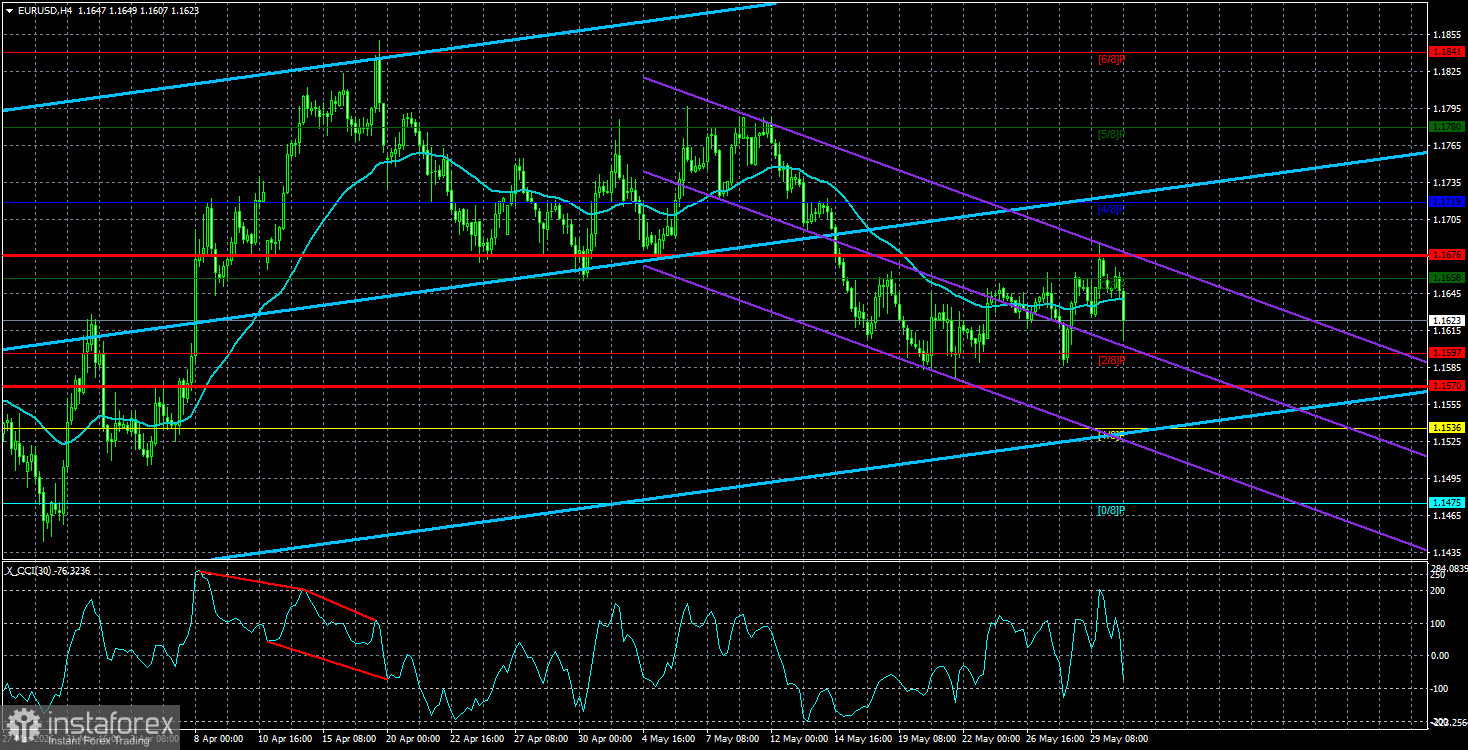
The EUR/USD currency pair traded very calmly on Monday, maintaining low volatility and a slight upward slope. However, as time passes, the market increasingly realizes that no deal between Tehran and Washington is to be expected anytime soon. Currently, words say one thing, while facts and actions indicate something entirely different. Donald Trump can sing daily about a future "magnificent deal with Iran" (which he is indeed doing), but the facts tell a different story. There is still no deal in sight. Iran remains firm in its stance and is genuinely puzzled by every statement made from the White House.
Just on Monday, Iran's chief negotiator, Parliament Speaker Bagher Ghalibaf, stated that there will be no deal with Washington until all of Iran's rights are fully assured. "We will not endorse any agreement until we are certain that all our rights and interests are protected," Ghalibaf declared. "Currently, the enemy (the US – ed.) is attempting through economic pressure and information campaigns to sow discord and destroy the country's cohesion to mask its military defeat and force us to surrender. They will achieve nothing," Ghalibaf added.
Thus, the rhetoric regarding a ceasefire, an agreement, the end of war, and the opening of the Strait of Hormuz differs as much as a cactus from a frying pan. So, who should one believe in these circumstances? Based on past experiences and from our perspective, it is not Trump. It is worth recalling that during the first term of the Republican in the White House, many analytical agencies kept count of how many blatantly false statements the US president made each day. Over his four-year presidency, it turned out that Trump made approximately 14.7 false statements every day.
We still see no signs of a resolution to the conflict or of the signing of a peace agreement. In this case, the American currency may be expected to grow moderately. The market is currently positioned such that there are no longer grounds for a mass flight to safety in the US dollar. Everyone looking to safeguard their capital has already done so back in February and March. At the same time, the dollar cannot fall under the current geopolitical circumstances, because the longer the conflict lasts, the more severe the energy crisis and its impacts on the global economy will be. Moreover, it should be understood that a prolonged conflict can return at any moment to a stage of active hostilities. Thus, risks remain elevated, creating a favorable foundation for the American currency. Besides, the last upswing is clearly corrective. If so, we can expect a new decline in the EUR/USD pair.
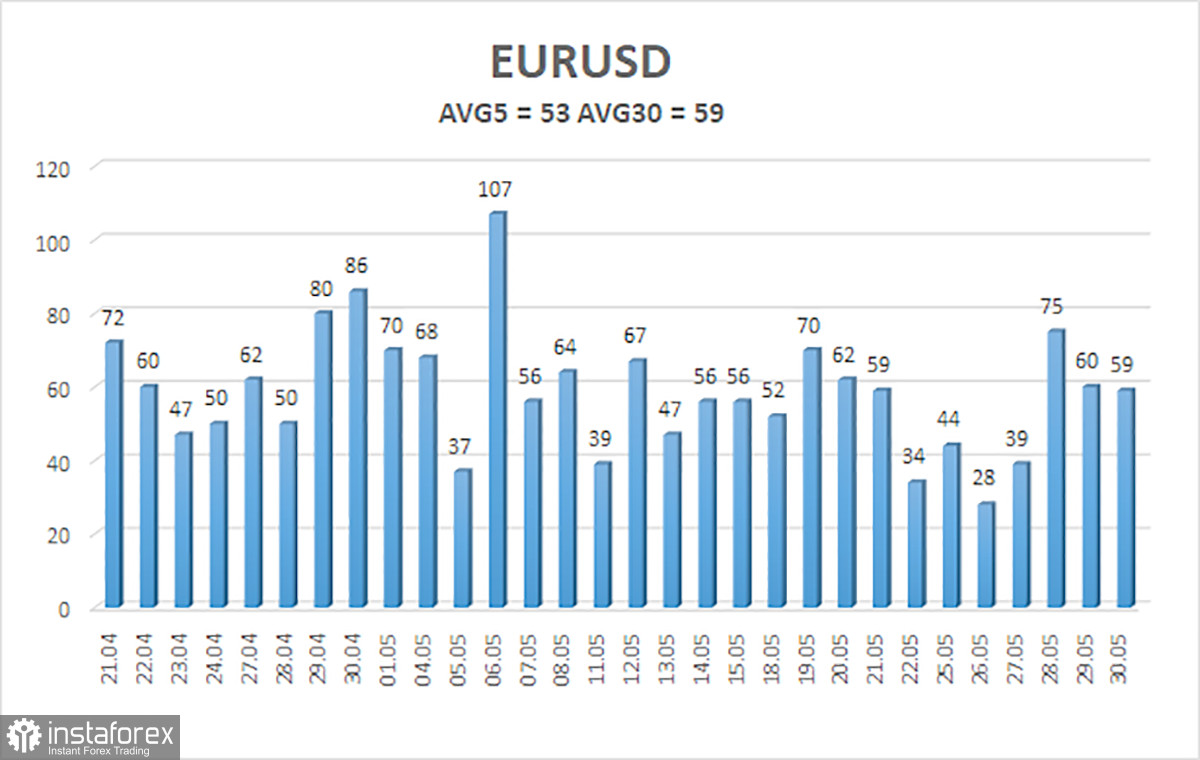
The average volatility of the EUR/USD currency pair over the last five trading days as of June 2 is 53 pips and is characterized as "medium-low." We expect the pair to trade between 1.1570 and 1.1676 on Tuesday. The upper channel of linear regression has turned upwards, indicating a shift to an upward trend. The actual upward trend from 2025 could have resumed as early as March. The CCI indicator has entered the overbought zone and formed two "bearish" divergences, signaling the beginning of a downward correction that is still unfolding.
The EUR/USD pair continues its downward movement, which is presumably a correction within the broader upward trend. The global fundamental background for the dollar remains extremely negative, and only the geopolitical factor regularly provides support. If the price remains below the moving average, shorts can be considered with targets at 1.1597 and 1.1570. Above the moving average, long positions become relevant with targets at 1.1780 and 1.1841. The market continues to distance itself from geopolitical factors, but in recent weeks, the dollar has remained in demand as hopes for peace in the Middle East have weakened.


