
Lihat juga


 31.08.2026 11:31 AM
The British pound major continues to form the downward wave that started in January. The current corrective movement toward the upper part of the price range began at the end of June. In recent weeks, after reaching the lower boundary of a strong potential reversal zone, the price has been retracing downward, forming the middle part of wave (B). Analysis of the structure of this section indicates that it is not yet complete.
At the beginning of the coming week, the British pound major may move sideways briefly with a downward bias. After reaching the specified levels, pressure on support cannot be ruled out, with a brief break below its lower boundary. A reversal and renewed upward movement should then be expected. The highest activity is likely toward the end of the week.
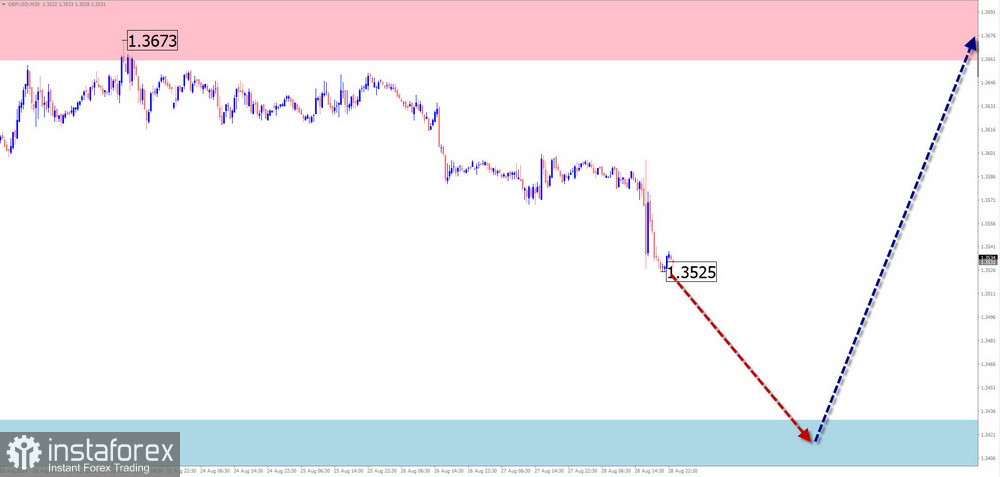
Resistance:
Support:
Buy: May become possible after corresponding signals appear near the support zone.
Sell: Associated with increased risk and have limited potential.
The daily timeframe chart of the Australian dollar major has been moving sideways since the beginning of the year. On a smaller timeframe, the bullish section that remains incomplete as of today started on June 30. The final part of wave (C) is forming within its structure. The calculated reversal zones coincide with potential reversal levels on various timeframes.
At the beginning of the coming week, a brief rise is expected, potentially reaching the resistance zone. A change in direction and the beginning of a decline in the pair's price can then be expected. The highest activity is likely toward the end of the week.
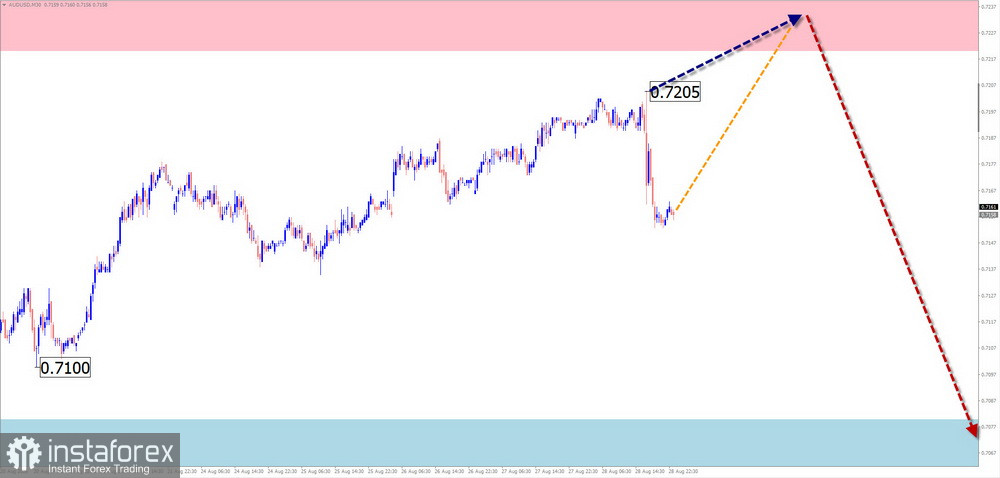
Resistance:
Support:
Buy: Premature until confirmed signals appear near the support zone.
Sell: Have limited potential and may be considered with a fractional volume during individual trading sessions.
An upward trend has been developing on the main Swiss franc pair chart since the beginning of the year. The middle part (B) has been approaching completion since the end of June. The quotes are moving mainly sideways, forming an extended flat. The upward section from August 20 has reversal potential.
The overall sideways movement of the price is expected to continue throughout the coming week. In the first few days, a continued rise can be expected, and pressure on the upper boundary of resistance cannot be ruled out. A change in direction and downward movement should then be expected. The highest activity is likely toward the end of the week.
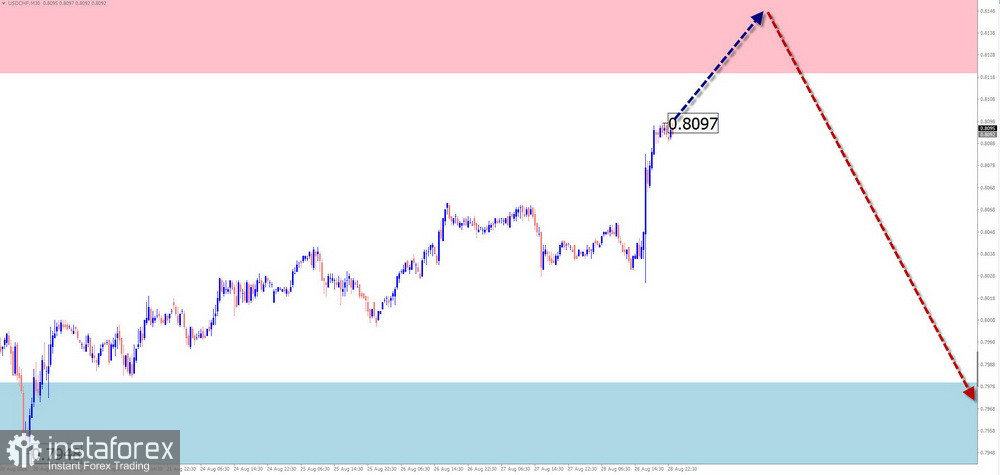
Resistance:
Support:
Sell: May become possible in the coming days after signals appear on your trading systems.
Buy: Trades are risky and have limited potential.
The upward wave of the euro against the Japanese yen pair since August 3 has marked a new section of the broader trend. Over the last ten days, the final part of a hidden correction (B) has been forming within the wave structure. After breaking through another resistance level, the price has been drifting sideways along it.
During the coming week, the pair's quotes are expected to continue moving within the price channel between the nearest opposing zones. At the beginning of the week, pressure on the support zone is possible. A reversal and renewed upward movement can be expected closer to the end of the week.
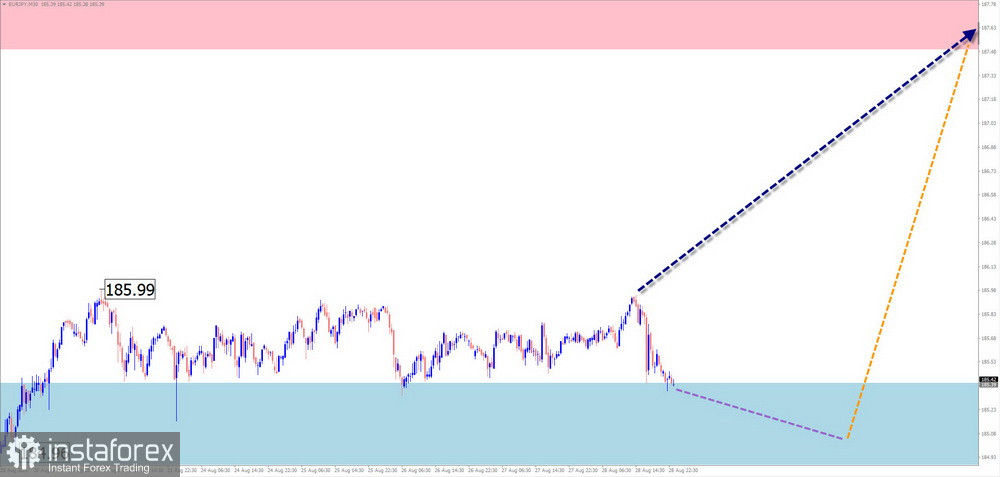
Resistance:
Support:
Sell: Has no potential.
Buy: May become possible after reversal signals appear near support on your trading systems.
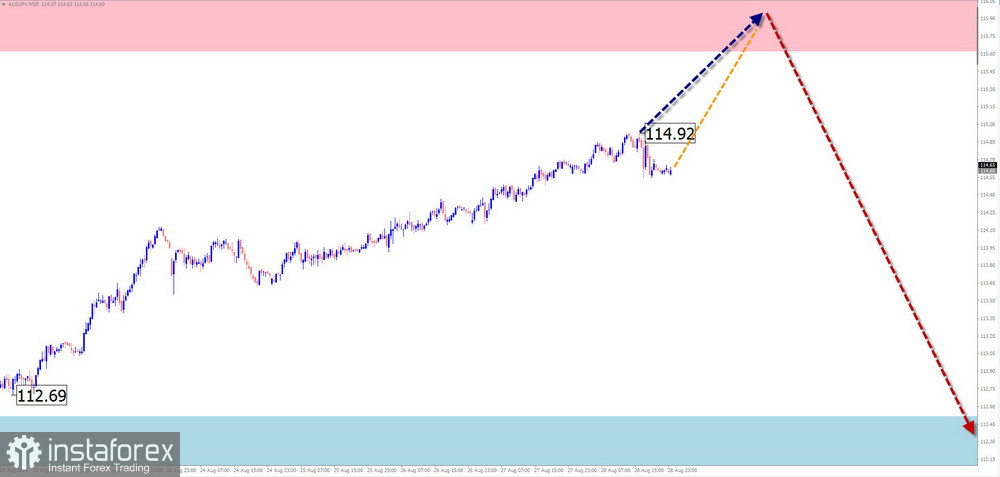
The direction of the Australian dollar/Japanese yen pair's short-term trend has been determined by the algorithm of an upward wave since last year. The incomplete section of the main price movement started on August 3. Price movements on the chart over the last ten days indicate the formation of the final part.
During the coming week, the price will continue moving within the corridor between the nearest zones of opposing directions. After the rise is completed and pressure on the upper boundary of the resistance zone is likely, a reversal and a change in the direction of movement to the downside are expected.
Resistance:
Support:
Sell: Premature until signals appear on your trading systems near the reversal zone.
Buy: Possible intraday with a fractional volume. Potential is limited by resistance.
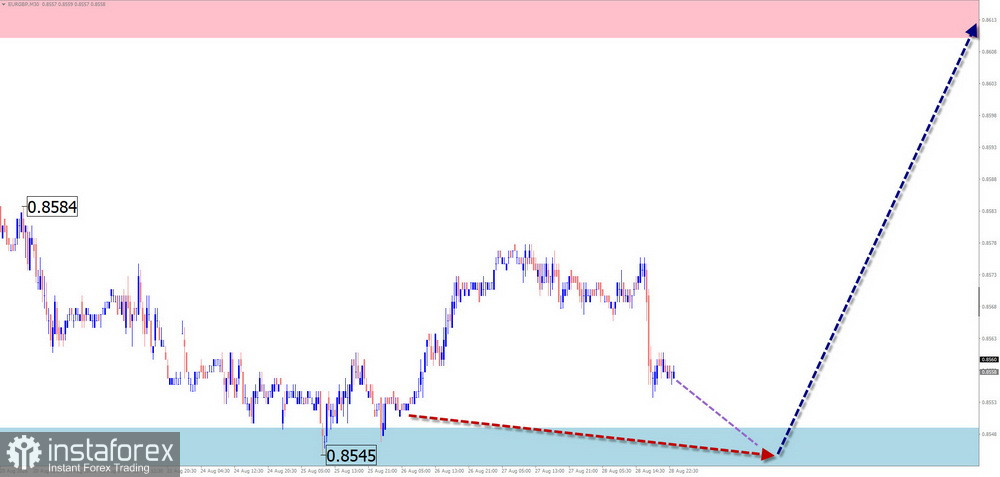
The incomplete upward wave of the euro/British pound cross has been developing since mid-July. The higher wave degree of the upward section indicates a new emerging trend. A corrective flat has been forming since July 30. The quotes are moving along the lower boundary of the price channel.
At the beginning of the current week, the overall sideways direction of the pair's price movement will continue. Closer to the end of the week, volatility is likely to increase, with the price resuming its upward movement. The calculated resistance indicates the upper boundary of the expected weekly price range.
Resistance:
Support:
Buy: May become possible after signals appear near support.
Sell: Has no potential and is risky.
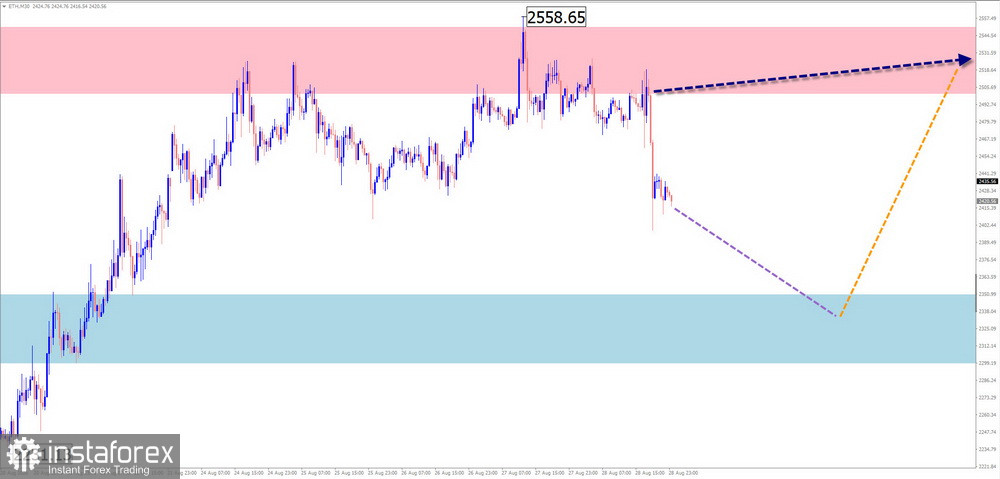
The latest relevant wave model on the Ethereum chart has been forming an extended flat since February. The lower boundary of a broad potential reversal zone is located near the calculated resistance level. Over the past week, the quotes have been forming a counter-trend retracement from the lower boundary of this zone. Its wave degree is insufficient for a reversal.
At the beginning of the coming week, the downward movement may continue. The price is likely to decline toward the boundaries of the support zone, where another potential reversal level of the hourly timeframe is located. A change in direction and renewed upward movement in Ether's price is then expected.
Resistance:
Support:
Sell: May be used during individual trading sessions with a reduced volume size. Potential is limited by support.
Buy: Premature until reversal signals confirmed by your trading systems appear near support.
In simplified wave analysis (SWA), all waves consist of three parts (A-B-C). On each timeframe, only the latest incomplete wave is analyzed. Solid arrows indicate the formed structure, while dashed arrows indicate expected movements.
Attention: The wave algorithm does not take into account the duration of instrument movements over time!


