Corak sebenar

Double Bottom
was formed on 20.05 at 16:45:13 (UTC+0)
signal strength 2 of 5
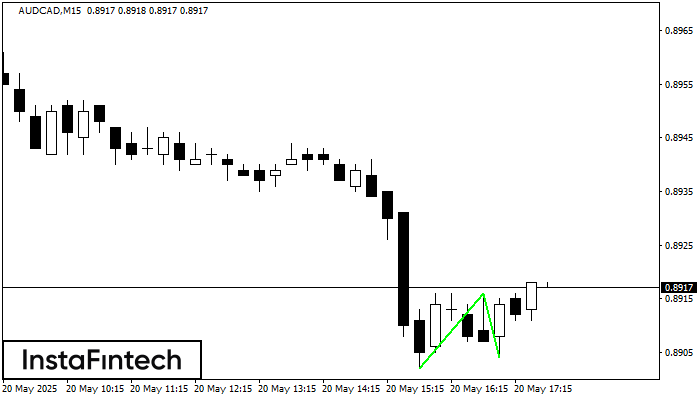
The Double Bottom pattern has been formed on AUDCAD M15. Characteristics: the support level 0.8902; the resistance level 0.8916; the width of the pattern 14 points. If the resistance level is broken, a change in the trend can be predicted with the first target point lying at the distance of 12 points.
The M5 and M15 time frames may have more false entry points.
- All
- All
- Bearish Rectangle
- Bearish Symmetrical Triangle
- Bearish Symmetrical Triangle
- Bullish Rectangle
- Double Top
- Double Top
- Triple Bottom
- Triple Bottom
- Triple Top
- Triple Top
- All
- All
- Buy
- Sale
- All
- 1
- 2
- 3
- 4
- 5
Pennant Aliran Menurun
was formed on 25.07 at 14:30:08 (UTC+0)
signal strength 2 of 5

Corak Pennant Aliran Menurun telah dibentuk pada carta GBPAUD M15. Ia menandakan potensi kesinambungan aliran yang sedia ada. Spesifikasi: bahagian corak mempunyai koordinat 2.0468; unjuran ketinggian flagpole adalah sama dengan
Carta masa M5 dan M15 mungkin mempunyai lebih banyak titik kemasukan palsu.
Open chart in a new window
Double Bottom
was formed on 25.07 at 14:00:19 (UTC+0)
signal strength 2 of 5

Corak Double Bottom telah dibentuk pada NZDUSD M15; sempadan atas adalah 0.6010; sempadan bawah adalah 0.6000. Lebar corak adalah 11 mata. Sekiranya penembusan sempadan atas 0.6010, perubahan aliran boleh diramalkan
Carta masa M5 dan M15 mungkin mempunyai lebih banyak titik kemasukan palsu.
Open chart in a new window
Inverse Head dan Shoulder
was formed on 25.07 at 13:55:30 (UTC+0)
signal strength 1 of 5

Berdasarkan carta M5, AUDCHF membentuk corak Inverse Head dan Shoulder. Bahagian atas Head ditetapkan pada 0.5232 manakala garisan median Neck didapati pada 0.5224/0.5229. Pembentukan corak Inverse Head dan Shoulder jelas
Carta masa M5 dan M15 mungkin mempunyai lebih banyak titik kemasukan palsu.
Open chart in a new window