Corak sebenar

Bearish Symmetrical Triangle
was formed on 16.06 at 18:26:13 (UTC+0)
signal strength 3 of 5
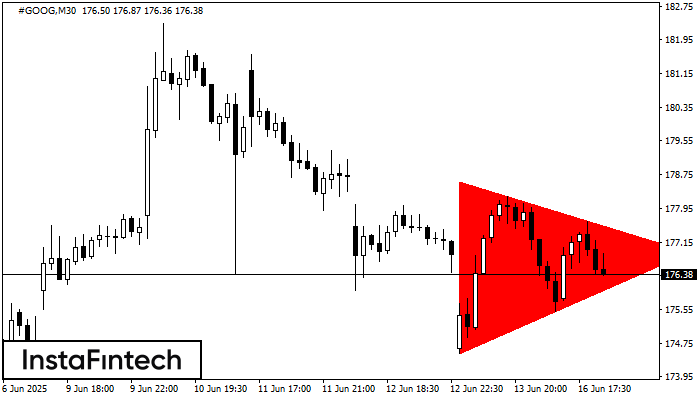
According to the chart of M30, #GOOG formed the Bearish Symmetrical Triangle pattern. Description: The lower border is 174.50/176.90 and upper border is 178.59/176.90. The pattern width is measured on the chart at -409 pips. The formation of the Bearish Symmetrical Triangle pattern evidently signals a continuation of the downward trend. In other words, if the scenario comes true and #GOOG breaches the lower border, the price could continue its move toward 176.60.
Juga lihat
- All
- All
- Bearish Rectangle
- Bearish Symmetrical Triangle
- Bearish Symmetrical Triangle
- Bullish Rectangle
- Double Top
- Double Top
- Triple Bottom
- Triple Bottom
- Triple Top
- Triple Top
- All
- All
- Buy
- Sale
- All
- 1
- 2
- 3
- 4
- 5
Double Top
was formed on 28.07 at 12:45:09 (UTC+0)
signal strength 1 of 5
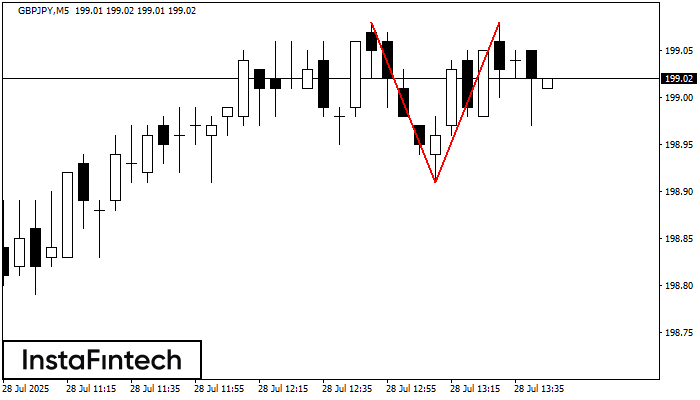
Corak Double Top telah dibentuk pada GBPJPY M5. Isyarat bahawa aliran telah berubah dari aliran menaik ke aliran menurun. Mungkin, sekiranya asas corak 198.91 ditembusi, pergerakan menurun akan berterusan
Carta masa M5 dan M15 mungkin mempunyai lebih banyak titik kemasukan palsu.
Open chart in a new window
Triple Bottom
was formed on 28.07 at 12:00:08 (UTC+0)
signal strength 1 of 5
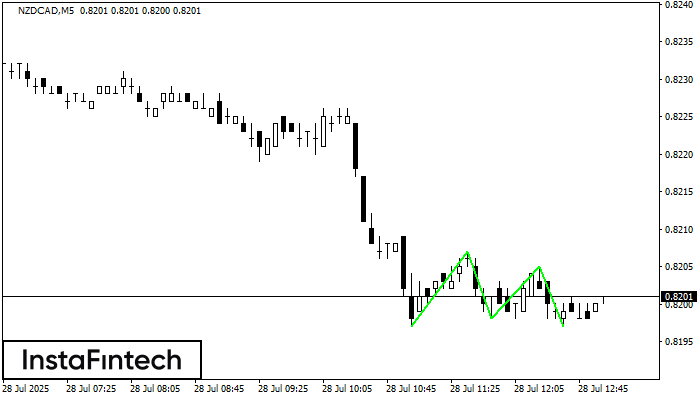
Corak Triple Bottom telah dibentuk pada NZDCAD M5. Ia mempunyai ciri-ciri berikut: tahap rintangan 0.8207/0.8205; tahap sokongan 0.8197/0.8197; lebar corak adalah 10 mata. Dalam situasi penembusan paras rintangan 0.8207, harga
Carta masa M5 dan M15 mungkin mempunyai lebih banyak titik kemasukan palsu.
Open chart in a new window
Triple Bottom
was formed on 28.07 at 11:59:48 (UTC+0)
signal strength 1 of 5
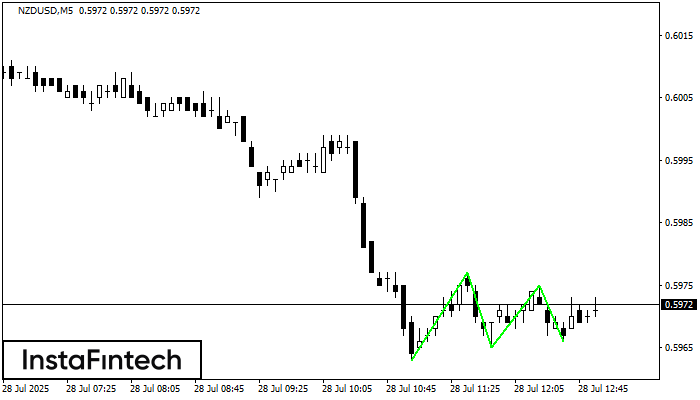
Corak Triple Bottom telah dibentuk pada NZDUSD M5. Ia mempunyai ciri-ciri berikut: tahap rintangan 0.5977/0.5975; tahap sokongan 0.5963/0.5966; lebar corak adalah 14 mata. Dalam situasi penembusan paras rintangan 0.5977, harga
Carta masa M5 dan M15 mungkin mempunyai lebih banyak titik kemasukan palsu.
Open chart in a new window