Corak sebenar

Triple Top
was formed on 20.06 at 08:25:40 (UTC+0)
signal strength 1 of 5
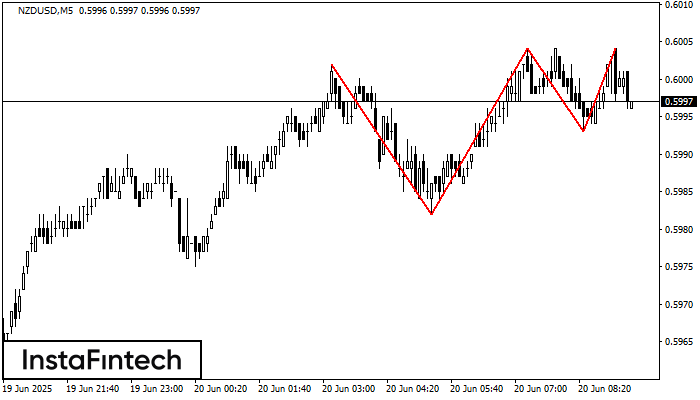
On the chart of the NZDUSD M5 trading instrument, the Triple Top pattern that signals a trend change has formed. It is possible that after formation of the third peak, the price will try to break through the resistance level 0.5982, where we advise to open a trading position for sale. Take profit is the projection of the pattern’s width, which is 20 points.
The M5 and M15 time frames may have more false entry points.
- All
- All
- Bearish Rectangle
- Bearish Symmetrical Triangle
- Bearish Symmetrical Triangle
- Bullish Rectangle
- Double Top
- Double Top
- Triple Bottom
- Triple Bottom
- Triple Top
- Triple Top
- All
- All
- Buy
- Sale
- All
- 1
- 2
- 3
- 4
- 5
Segi Empat Menurun
was formed on 28.07 at 03:52:46 (UTC+0)
signal strength 2 of 5

Berdasarkan carta M15, NZDCHF telah membentuk Segi Empat Menurun. Jenis corak ini menunjukkan kesinambungan aliran. Ia terdiri daripada dua tahap: rintangan 0.4790 - 0.0000 dan sokongan 0.4776 – 0.4776. Sekiranya
Carta masa M5 dan M15 mungkin mempunyai lebih banyak titik kemasukan palsu.
Open chart in a new window
Segi Empat Menurun
was formed on 28.07 at 03:51:32 (UTC+0)
signal strength 3 of 5
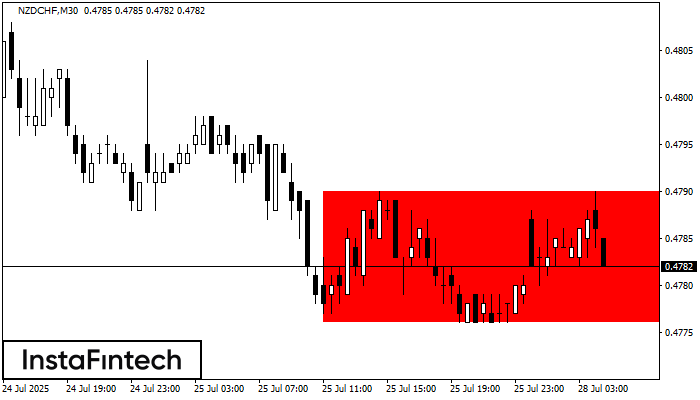
Berdasarkan carta M30, NZDCHF telah membentuk Segi Empat Menurun yang merupakan corak kesinambungan aliran. Corak terkandung dalam sempadan berikut: sempadan bawah 0.4776 – 0.4776 dan sempadan atas 0.4790 – 0.4790
Open chart in a new window
Double Top
was formed on 28.07 at 03:30:20 (UTC+0)
signal strength 2 of 5
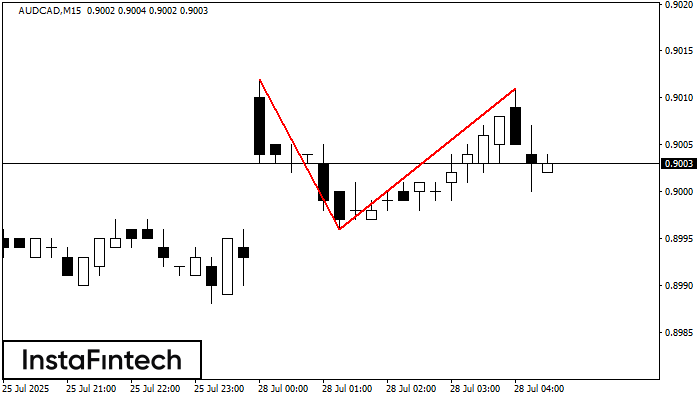
Corak Double Top telah dibentuk pada AUDCAD M15. Isyarat bahawa aliran telah berubah dari aliran menaik ke aliran menurun. Mungkin, sekiranya asas corak 0.8996 ditembusi, pergerakan menurun akan berterusan
Carta masa M5 dan M15 mungkin mempunyai lebih banyak titik kemasukan palsu.
Open chart in a new window