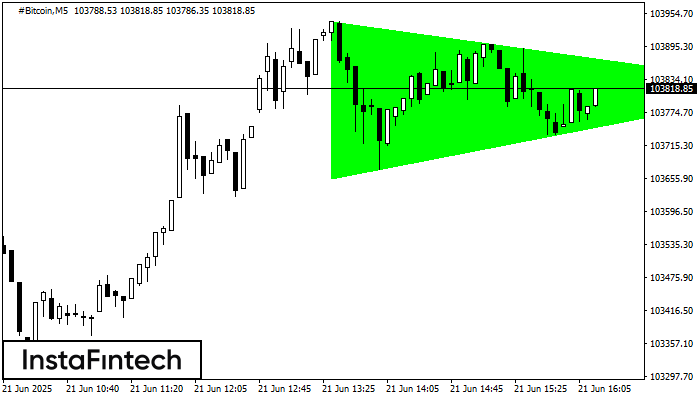
Bullish Symmetrical Triangle
was formed on 21.06 at 15:17:59 (UTC+0)
signal strength 1 of 5

According to the chart of M5, #Bitcoin formed the Bullish Symmetrical Triangle pattern. The lower border of the pattern touches the coordinates 103655.19/103820.77 whereas the upper border goes across 103940.04/103820.77. If the Bullish Symmetrical Triangle pattern is in progress, this evidently signals a further upward trend. In other words, in case the scenario comes true, the price of #Bitcoin will breach the upper border to head for 103820.90.
The M5 and M15 time frames may have more false entry points.
Figure
Instrument
Timeframe
Trend
Signal Strength


